Долзарб паттернлар

Двойное дно
сформирован 29.05 в 20:10:48 (UTC+0)
сила сигнала 1 из 5
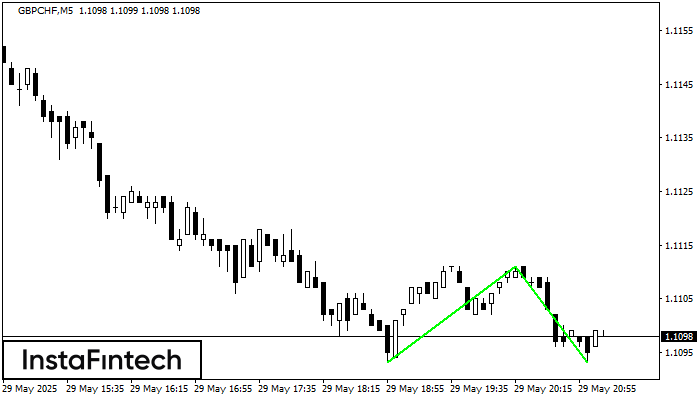
Сформирована фигура «Двойное дно» на графике GBPCHF M5. Верхняя граница 1.1111; Нижняя граница 1.1093; Ширина фигуры 18 пунктов. В случае пробоя верхней границы 1.1111 можно будет прогнозировать изменение тенденции, где ширина фигуры и будет являться расстоянием предположительного Тейк Профита.
Таймфреймы М5 и М15 могут иметь больше ложных точек входа.
- Все
- Все
- Bearish Rectangle
- Bearish Symmetrical Triangle
- Bearish Symmetrical Triangle
- Bullish Rectangle
- Double Top
- Double Top
- Triple Bottom
- Triple Bottom
- Triple Top
- Triple Top
- Все
- Все
- Покупка
- Продажа
- Все
- 1
- 2
- 3
- 4
- 5
Triple Bottom
was formed on 20.06 at 22:20:23 (UTC+0)
signal strength 1 of 5

The Triple Bottom pattern has been formed on GOLD M5. It has the following characteristics: resistance level 3372.86/3370.25; support level 3364.73/3364.26; the width is 813 points. In the event
The M5 and M15 time frames may have more false entry points.
Open chart in a new window
Bearish Rectangle
was formed on 20.06 at 20:57:12 (UTC+0)
signal strength 2 of 5

According to the chart of M15, #GOOG formed the Bearish Rectangle. The pattern indicates a trend continuation. The upper border is 170.41, the lower border is 169.00. The signal means
The M5 and M15 time frames may have more false entry points.
Open chart in a new window
Bearish Symmetrical Triangle
was formed on 20.06 at 20:55:46 (UTC+0)
signal strength 1 of 5

According to the chart of M5, #TSLA formed the Bearish Symmetrical Triangle pattern. This pattern signals a further downward trend in case the lower border 317.55 is breached. Here
The M5 and M15 time frames may have more false entry points.
Open chart in a new window