Actual patterns

Patterns are graphical models which are formed in the chart by the price. According to one of the technical analysis postulates, history (price movement) repeats itself. It means that the price movements are often similar in the same situations which makes it possible to predict the further development of the situation with a high probability.
Relevant patterns by InstaTrade is an easy-to-use service which allows you to be aware of latest changes in the market and react to clues from the market in time. In our service you will always find the latest and most relevant patterns on any pair and any timeframe.
Inverse Head and Shoulder
was formed on 16.05 at 15:30:18 (UTC+0)
signal strength 3 of 5
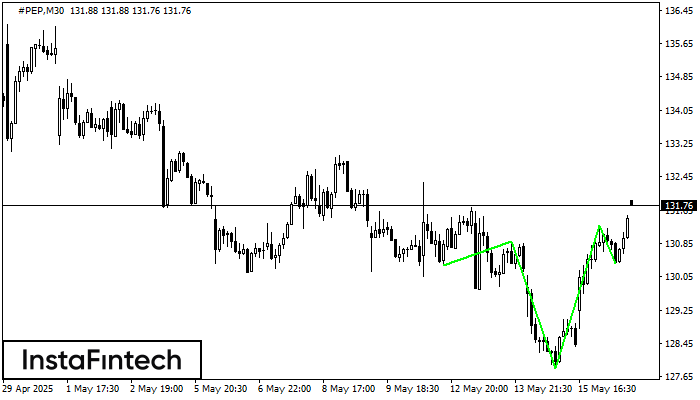
According to the chart of M30, #PEP produced the pattern termed the Inverse Head and Shoulder. The Head is fixed at 127.86 while the median line of the Neck is set at 130.89/131.28. The formation of the Inverse Head and Shoulder Pattern clearly indicates a reversal of the downward trend. In means that in case the scenario comes true, the price of #PEP will go towards 131.58.
- All
- All
- Bearish Rectangle
- Bearish Symmetrical Triangle
- Bearish Symmetrical Triangle
- Bullish Rectangle
- Double Top
- Double Top
- Triple Bottom
- Triple Bottom
- Triple Top
- Triple Top
- All
- All
- Buy
- Sale
- All
- 1
- 2
- 3
- 4
- 5
Bullish Symmetrical Triangle
was formed on 19.06 at 21:28:55 (UTC+0)
signal strength 1 of 5
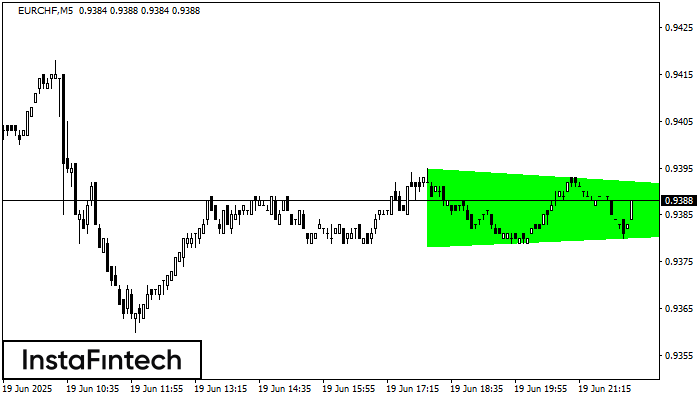
According to the chart of M5, EURCHF formed the Bullish Symmetrical Triangle pattern, which signals the trend will continue. Description. The upper border of the pattern touches the coordinates 0.9395/0.9385
The M5 and M15 time frames may have more false entry points.
Open chart in a new window
Bearish Flag
was formed on 19.06 at 20:10:43 (UTC+0)
signal strength 1 of 5
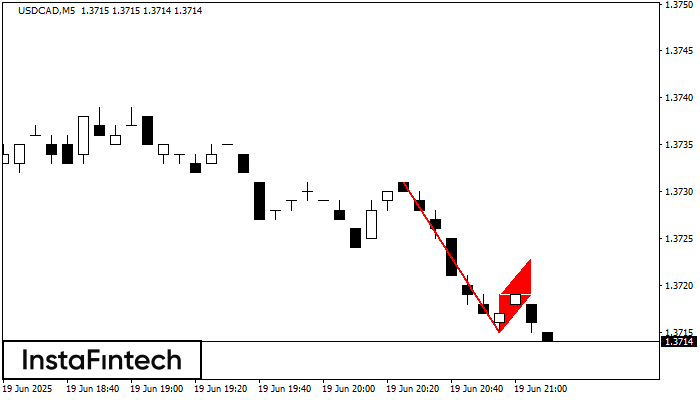
The Bearish Flag pattern has been formed on USDCAD at M5. The lower boundary of the pattern is located at 1.3715/1.3719 while the upper boundary lies at 1.3719/1.3723. The projection
The M5 and M15 time frames may have more false entry points.
Open chart in a new window
Bearish pennant
was formed on 19.06 at 20:10:37 (UTC+0)
signal strength 1 of 5
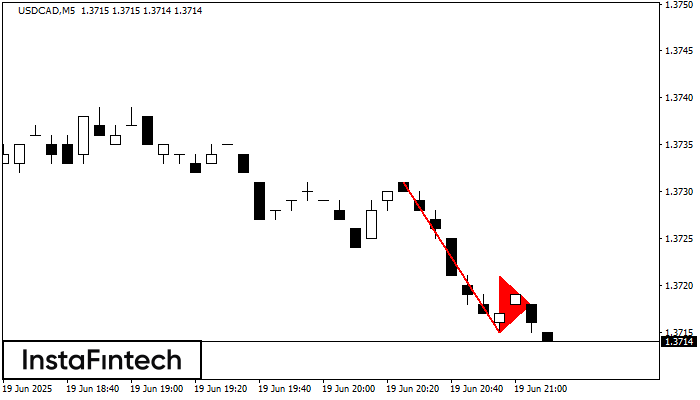
The Bearish pennant pattern has formed on the USDCAD M5 chart. It signals potential continuation of the existing trend. Specifications: the pattern’s bottom has the coordinate of 1.3715; the projection
The M5 and M15 time frames may have more false entry points.
Open chart in a new window