یہ بھی دیکھیں

 10.04.2023 06:40 AM
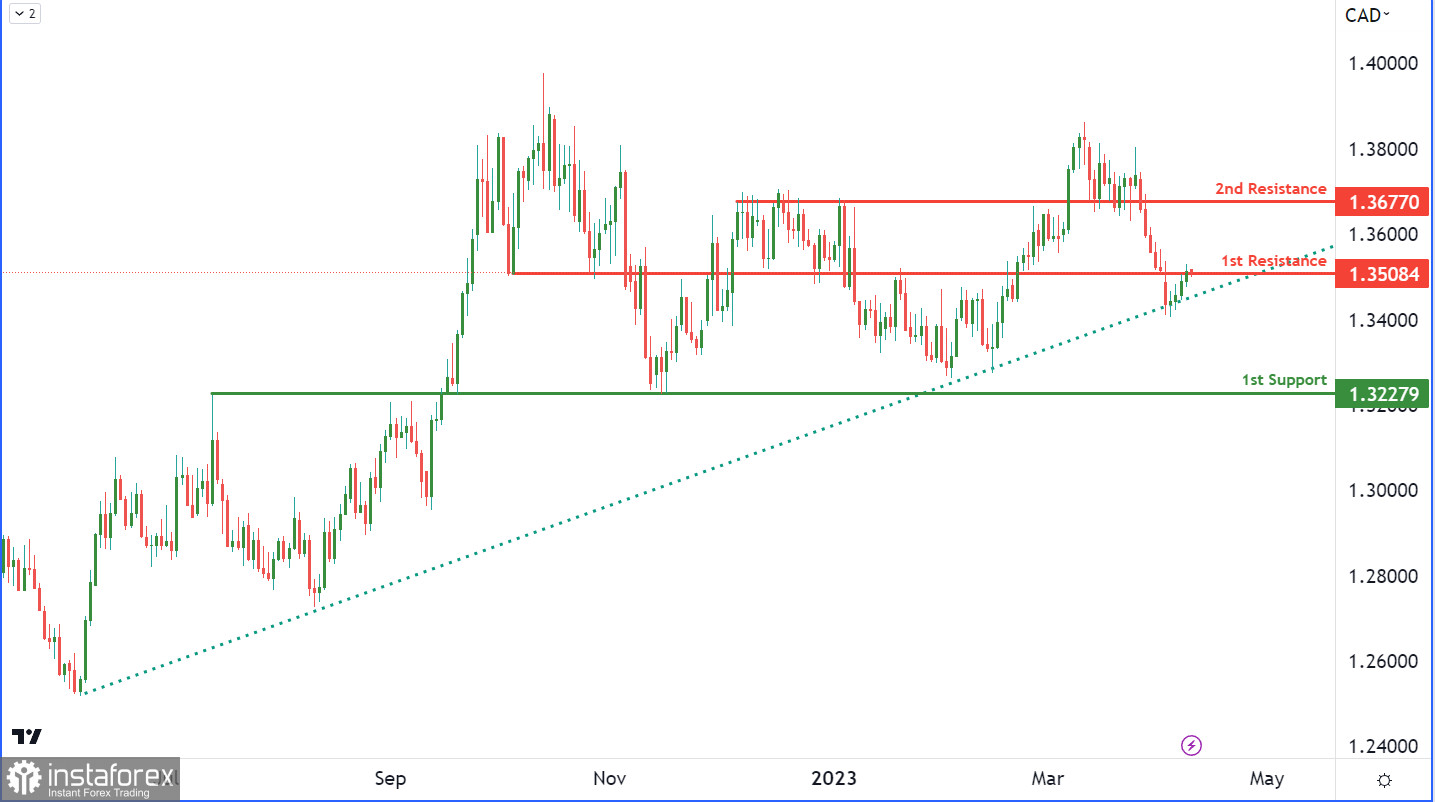
The USD/CAD chart is displaying a strong bullish momentum, as the current price is trading above a major ascending trend line. This trend line indicates that we may see further bullish price action in the near future.
If price continues to rise, it could potentially break through the first resistance level at 1.3508, which is also an overlap resistance, and move towards the second resistance level at 1.3677. However, if price falls below the current support level of 1.3227, it may potentially drop towards the next support level at 1.3000, which is a major overlap support.
It is important to note that the 1st resistance level at 1.3508 is a crucial level to watch, as a break above it could trigger a stronger bullish acceleration towards the 2nd resistance level. In summary, the overall bias of the USD/CAD chart is bullish, but a break below the support level may indicate a potential bearish shift in momentum.
You have already liked this post today
*تعینات کیا مراد ہے مارکیٹ کے تجزیات یہاں ارسال کیے جاتے ہیں جس کا مقصد آپ کی بیداری بڑھانا ہے، لیکن تجارت کرنے کے لئے ہدایات دینا نہیں.


