یہ بھی دیکھیں

 30.04.2025 01:15 PM
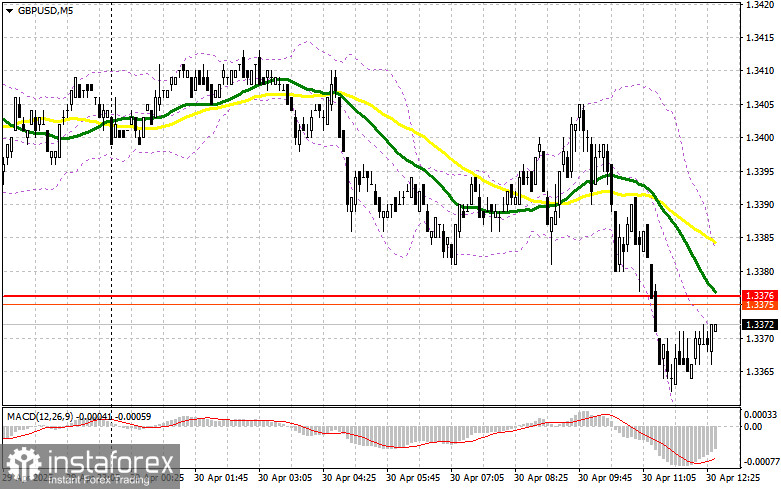
In my morning forecast, I drew attention to the 1.3376 level and planned to base market entry decisions on it. Let's take a look at the 5-minute chart and analyze what happened. The decline toward 1.3376 occurred, but a false breakout never formed. As a result, I remained without trades in the first half of the day. The technical picture was revised for the second half of the day.
To open long positions on GBP/USD:
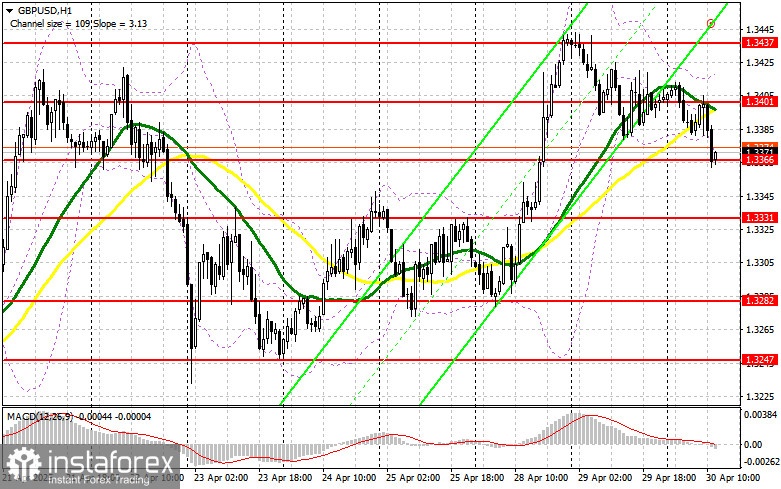
Disappointed by weak housing price index data from Nationwide in the UK, the British pound continued its correction against the U.S. dollar, which began during the Asian session. In the second half of the day, pressure on the pair may increase further. Strong reports on U.S. Q1 GDP and ADP employment growth will be enough to push the pair lower. The Core PCE Index and data on U.S. personal income and spending will also be in focus. If the pair continues to decline, I expect the first active buying near 1.3366. A false breakout at that level will provide a good entry point for long positions, aiming for a recovery toward resistance at 1.3401, formed during the first half of the day. A breakout and retest from top to bottom of this range will create a new entry point for long positions, with the prospect of a move toward 1.3437 — the monthly high — which would restore the bullish trend. The furthest target will be the 1.3474 area, where I plan to take profit. If GBP/USD continues falling and there's no bullish activity around 1.3366 in the second half of the day — which is more likely — the pound will resume its decline. In that case, only a false breakout around 1.3331 will be a suitable condition for opening long positions. I plan to buy GBP/USD immediately on a rebound from support at 1.3282, targeting a 30–35 point intraday correction.
To open short positions on GBP/USD:
Sellers showed themselves in the first half of the day, leading to the continuation of the pair's correction. And it appears this correction is not over yet. Given the end of the month and the anticipated U.S. data, pressure on the pound may only increase. If GBP/USD rises after weak U.S. data, I will act only after a false breakout forms near resistance at 1.3401, where the moving averages are located — currently favoring sellers. This will provide an entry point for selling, targeting a decline toward the 1.3366 support, which is now being defended. A breakout and retest from bottom to top of this range will trigger stop-losses and open the path to 1.3331. The furthest target will be the 1.3282 area, where I plan to take profit. If demand for the pound returns in the second half of the day and bears fail to assert themselves around 1.3401, it would be better to postpone selling until the pair tests the 1.3437 resistance — the new monthly high. I will open short positions there only after a false breakout. If there is no downward movement even there, I will look for short positions on a rebound from 1.3474, but only in anticipation of a 30–35 point intraday downward correction.
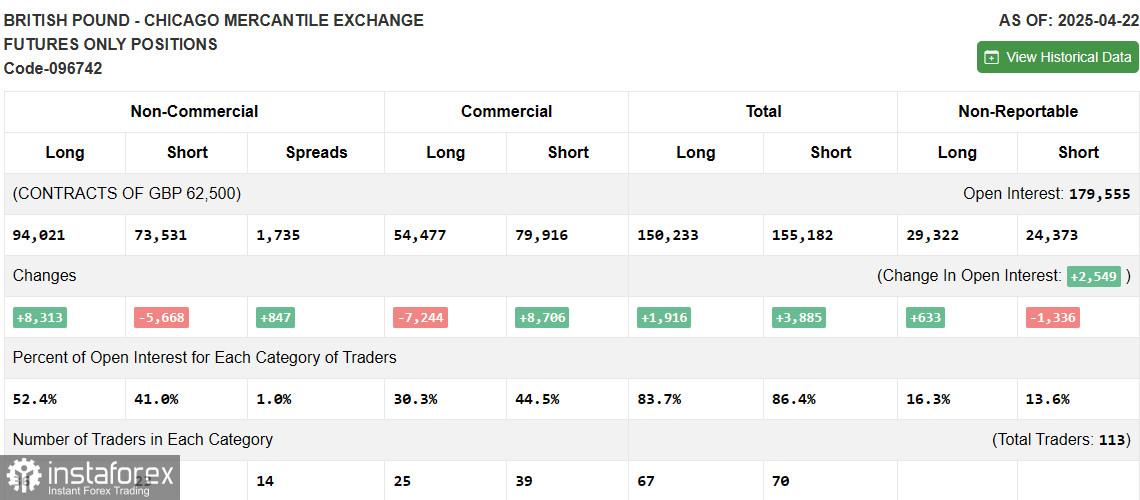
The COT (Commitment of Traders) report for April 22 showed an increase in long positions and a decrease in short ones. Considering that the Bank of England is not planning further rate cuts for now, this factor is currently supporting the pound and allowing it to continue rising against the U.S. dollar. However, a compromise in U.S.-China trade negotiations is having a restraining effect and is helping sustain demand for the U.S. dollar. In the near term, the key drivers will be U.S. economic growth figures for Q1 and the April labor market report. The latest COT report shows that long non-commercial positions increased by 8,313 to 94,021, while short non-commercial positions fell by 5,668 to 73,531. As a result, the gap between long and short positions widened by 847.
Indicator signals:
Moving Averages
Trading is taking place below the 30- and 50-day moving averages, indicating a decline in the pound.
Note: The period and prices of the moving averages are based on the author's H1 (hourly) chart and differ from the standard daily moving averages on the D1 chart.
Bollinger Bands
In the event of a decline, the lower boundary of the indicator around 1.3366 will act as support.
Indicator descriptions • Moving average (identifies the current trend by smoothing out volatility and noise). Period – 50. Marked in yellow on the chart. • Moving average (identifies the current trend by smoothing out volatility and noise). Period – 30. Marked in green on the chart. • MACD indicator (Moving Average Convergence/Divergence – convergence/divergence of moving averages): Fast EMA – period 12, Slow EMA – period 26, SMA – period 9. • Bollinger Bands. Period – 20. • Non-commercial traders – speculators such as individual traders, hedge funds, and large institutions using the futures market for speculative purposes and meeting specific criteria. • Long non-commercial positions represent the total long open positions of non-commercial traders. • Short non-commercial positions represent the total short open positions of non-commercial traders. • Net non-commercial position is the difference between short and long positions of non-commercial traders.


