یہ بھی دیکھیں

 06.05.2025 03:32 AM
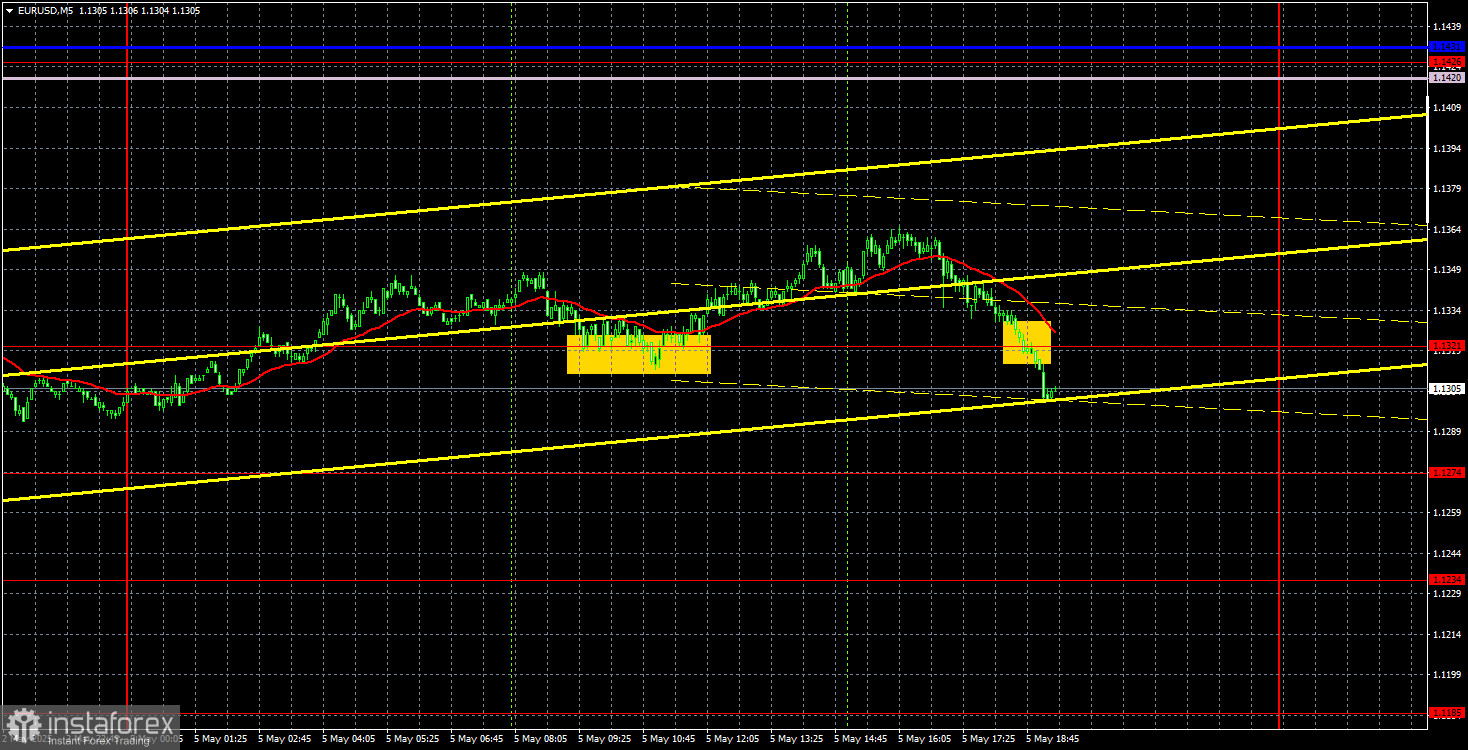
On Monday, the EUR/USD currency pair resumed its favorite activity right from the morning—moving north. It was revealed that after a three-week pause, Donald Trump decided to bring a bit of "freshness" to the markets by introducing new tariffs. This time, however, they did not target a specific industry or country. Instead, they were directed at the film industry. Trump argued that the arts are no different from automobile manufacturing and that tariffs should be paid to the treasury if they don't want to produce content exclusively within the U.S.
The challenge is figuring out exactly who these tariffs are meant to target. Foreign countries could stop exporting films to the U.S., while American companies producing content abroad would be forced to pay 100% tariffs. Once again, American consumers and businesses end up footing the bill for Trump's tariffs. Essentially, the U.S. president could impose levies on virtually anything in America.
The incredible happened in the second half of the day. The U.S. ISM Services PMI for April turned out stronger than expected—but that's not the most interesting part. The real surprise was that the market responded to this report despite ignoring nearly all macroeconomic data last week. Thanks to the ISM index, the dollar managed to avoid a decline by the end of the day.
As for trading signals, Monday's volatility was low, resulting in just two relatively weak signals around the 1.1321 level. First, the price bounced off this level and consolidated below it. In both cases, the nearest targets were not reached, but the price did move a certain distance in the right direction. Therefore, traders could have avoided losses.
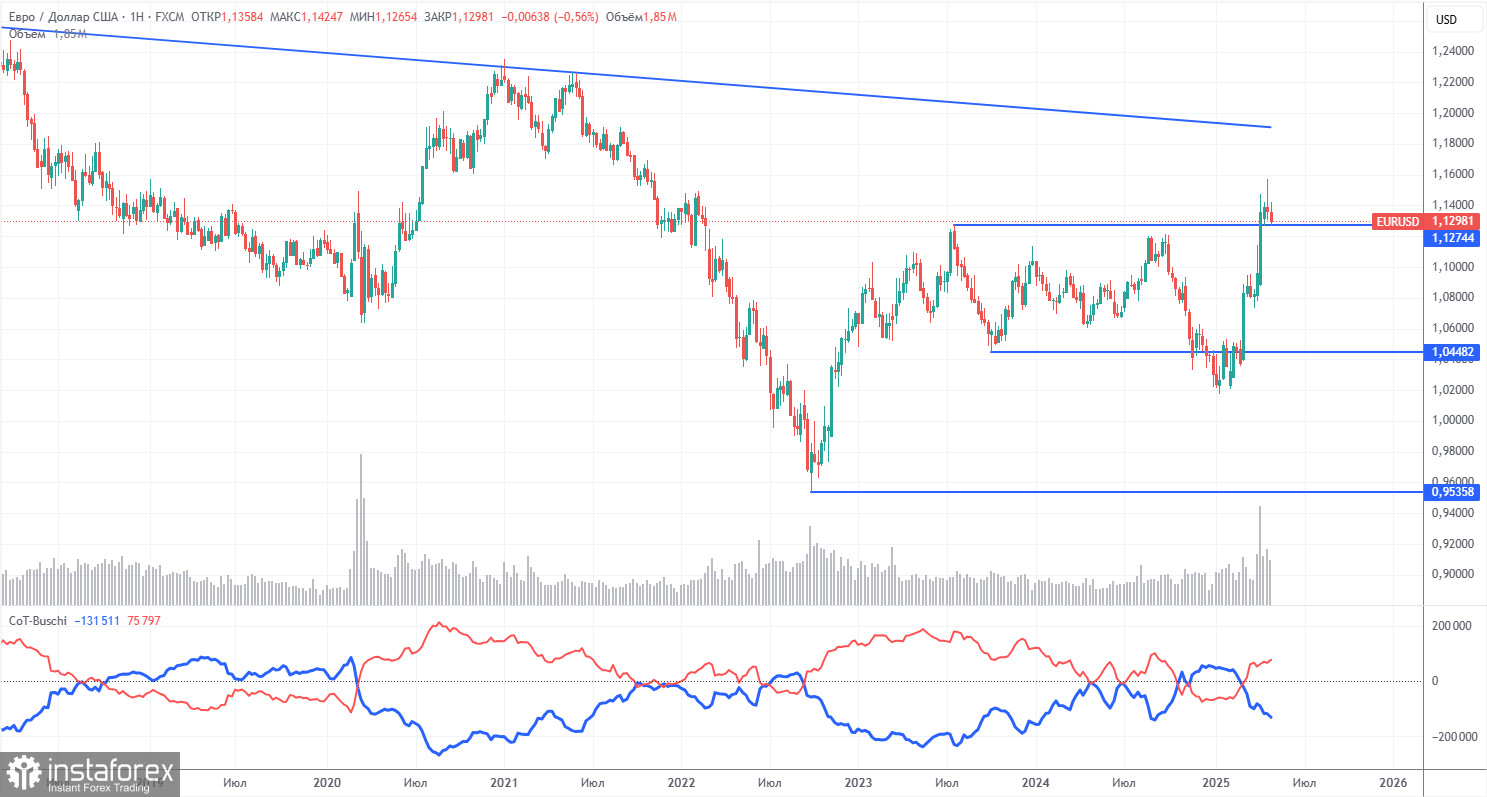
The latest Commitment of Traders (COT) report is dated April 29. The chart above clearly shows that the net position of non-commercial traders has remained bullish for a long time. Bears barely managed to gain the upper hand but quickly lost it. Since Donald Trump took office, the dollar has been on a steep decline. We cannot definitively say that this decline will continue indefinitely, and the COT reports reflect the sentiment of large players—which, under the current circumstances, can change very quickly.
Still, we continue to see no fundamental reasons for the euro to strengthen, while the dollar does have one significant reason to decline. The pair may continue to correct for a few more weeks or months, but the 16-year downtrend for the U.S. currency is unlikely to end so easily.
The red and blue lines have crossed again, signaling a bullish market trend. Over the last reporting week, long positions among non-commercial traders increased by 200, while short positions dropped by 10,600. As a result, the net position grew by 10,400 thousand contracts.
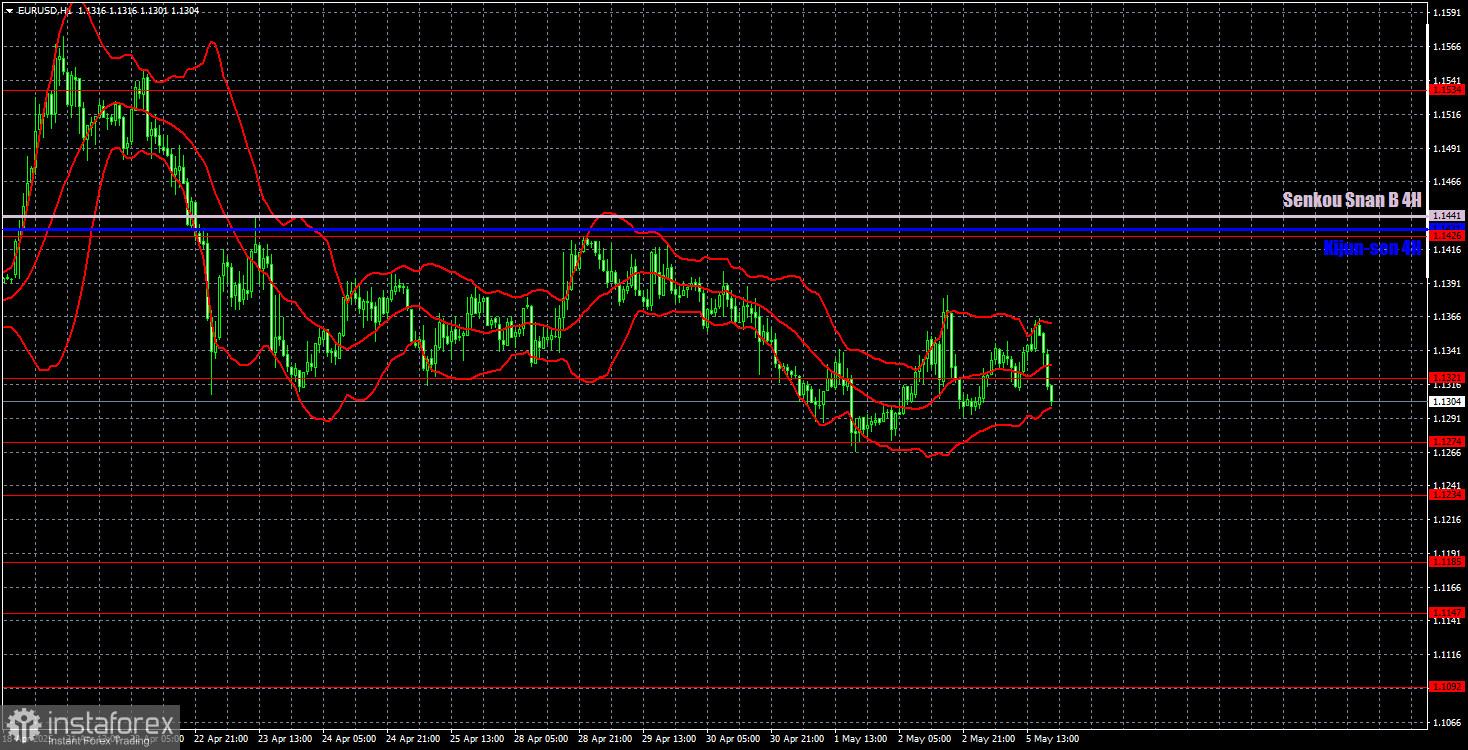
In the hourly timeframe, the EUR/USD pair maintains a bullish trend, but in recent weeks, it has been trading in a sideways range due to the lack of new developments in Trump's trade disputes. There is little logic or technical structure in the current movements across any timeframe, and the macroeconomic backdrop has virtually no influence on the pair's direction. The market continues to wait for trade war headlines—either escalation or de-escalation—and until such updates appear, it seems unwilling to trade decisively in any direction.
For May 6, we highlight the following levels for trading - 1.0823, 1.0886, 1.0949, 1.1006, 1.1092, 1.1147, 1.1185, 1.1234, 1.1274, 1.1321, 1.1426, 1.1534, 1.1607, 1.1666, as well as the Senkou Span B (1.1441) and Kijun-sen (1.1431) lines. Note: Ichimoku indicator lines may shift during the day and should be considered when identifying trade signals. Also, don't forget to place a Stop Loss at breakeven once the price moves 15 pips in the right direction. This will help prevent losses if the signal turns out to be false.
On Tuesday, the Eurozone is set to release second estimates for April's services PMI data for Germany and the EU. These are relatively minor reports, and we believe the market will likely ignore them entirely. In any case, the pair remains trapped within a flat range, with movements that continue to be erratic and mostly non-technical.


