یہ بھی دیکھیں

 08.05.2025 05:09 AM
USD/JPY
The daily chart shows that the price is reversing downward from the green price channel lines. The first such reversal occurred on May 2, marked by a red arrow, while the second reversal is taking place today at the opening of the trading session (indicated by a blue arrow).
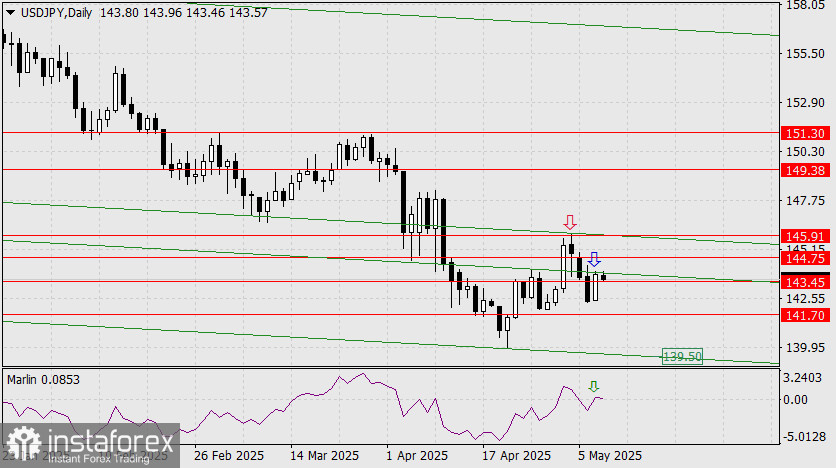
Moreover, today's reversal is synchronized with a downward reversal of the Marlin oscillator from the zero line. If today's daily candle closes below the 143.45 level, it will open the path toward the nearest target at 141.70, and potentially to the lower boundary of the price channel near the 139.50 mark.
Conversely, a close above yesterday's high at 144.00 would activate an alternative bullish scenario, with potential growth toward 144.75 and a longer-term target at 145.91 — a magnet point formed at the intersection of the channel line with the horizontal level.
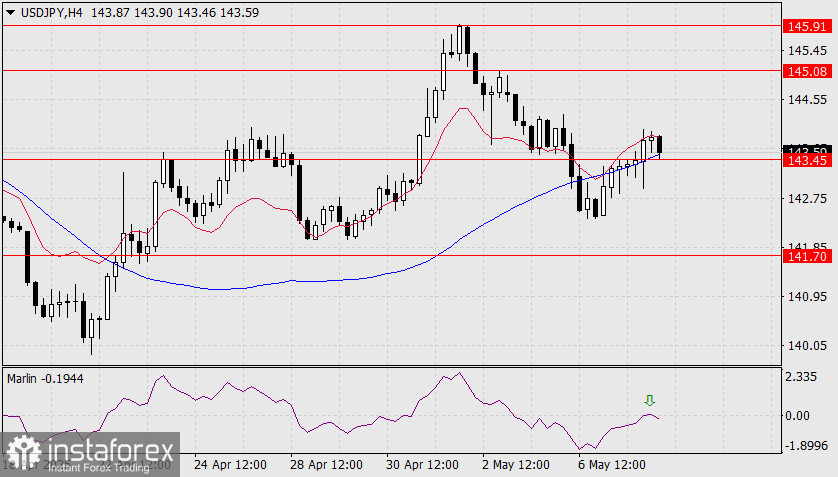
On the four-hour chart, the Marlin oscillator's reversal from the zero line aligns perfectly with the same reversal seen on the daily timeframe. This creates a strong reversal pattern. The price is currently testing support at the MACD line and the key level at 143.45. A firm break below this level would confirm the start of the main bearish scenario for the USD/JPY pair.
You have already liked this post today
*تعینات کیا مراد ہے مارکیٹ کے تجزیات یہاں ارسال کیے جاتے ہیں جس کا مقصد آپ کی بیداری بڑھانا ہے، لیکن تجارت کرنے کے لئے ہدایات دینا نہیں.


