یہ بھی دیکھیں

 16.05.2025 05:07 AM
Friday may mark the fourth consecutive day of a bearish (black) daily candle. The last time this pattern occurred was from February 3–6. In that instance—and the two previous occurrences—a minimum 1–2 day correction followed. The price is trading within the 145.08/91 range, sitting on the MACD line.

The Marlin oscillator has not yet exited the growth zone, so even if the price does not break upward out of the range, a breakdown below the MACD line may not happen today, or even by Monday.
However, consolidation could also follow a close below the MACD line. In that case, the series of declining black candles would increase to five. This could set the stage for a move similar in structure—if not in pace—to the drop observed between July 22 and August 5, 2024. For now, the market awaits further developments. The main scenario remains bearish.
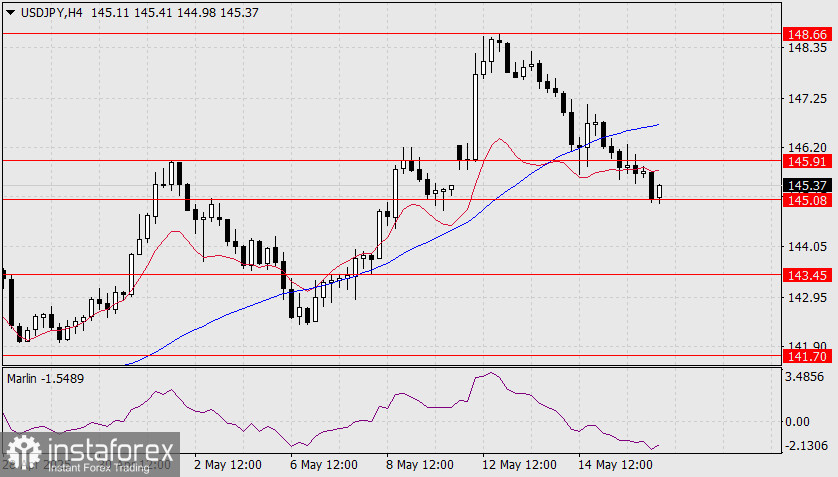
On the four-hour chart, the price has settled below the balance line, but not yet below the 145.08 level. Marlin is drifting downward, though without a clear signal of trend continuation or reversal—the decline appears sluggish. A close below 145.08 would increase the likelihood of today ending as another bearish candle.
You have already liked this post today
*تعینات کیا مراد ہے مارکیٹ کے تجزیات یہاں ارسال کیے جاتے ہیں جس کا مقصد آپ کی بیداری بڑھانا ہے، لیکن تجارت کرنے کے لئے ہدایات دینا نہیں.


