یہ بھی دیکھیں

 23.05.2025 04:45 AM
On Thursday, Bitcoin's price reached the target level of 111,770. The Marlin oscillator appears to be lagging behind the price, giving the impression of a potential divergence — though unconventional. For now, we adhere to the scenario of the oscillator developing within a long-term upward channel.
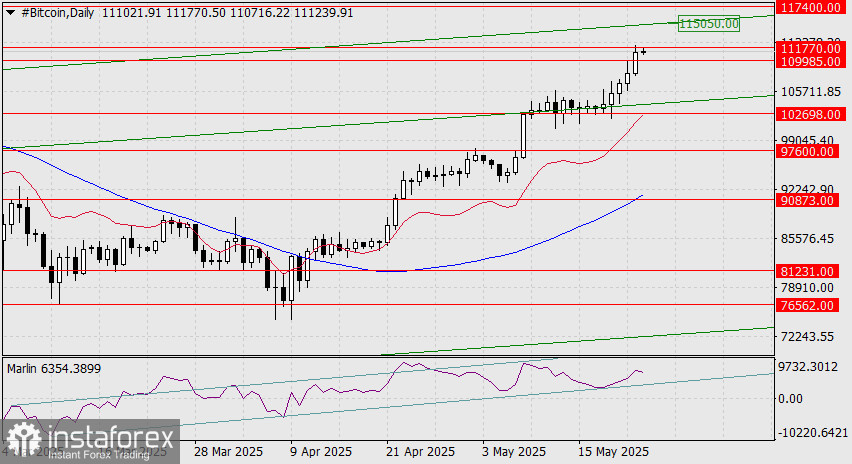
A correction from the current level is certainly possible. The reference level is 109,985, which corresponds to the January 20 high. A decline to this support level would not significantly affect the overall bullish trend. At this stage, Marlin becomes the key indicator — it should remain above the lower boundary of its channel.
Once the correction is complete and the price breaks above 111,770, the next target will be 115,050 — the upper line of the price channel — followed by 117,400, which represents the 361.8% Fibonacci reaction level from the primary wave in the first half of April.
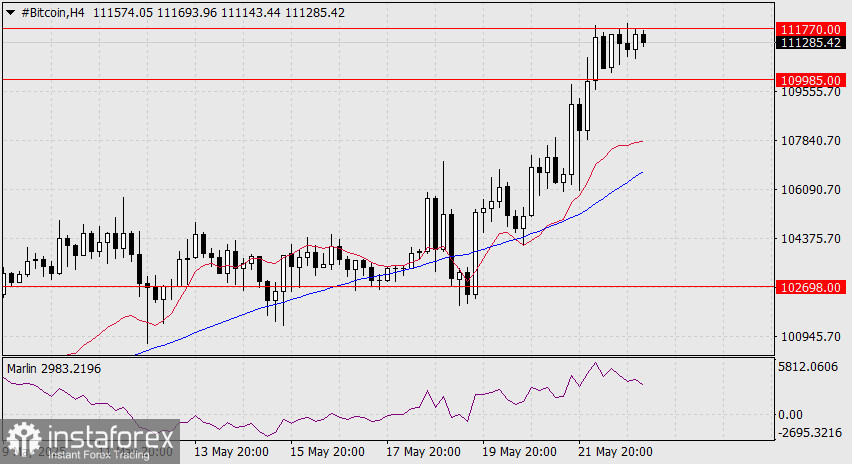
On the 4-hour chart, the price has formed a triangular consolidation pattern below the 111,770 level, while the Marlin oscillator is declining. This creates the setup for an upward move from a lower base. We now await the correction's end.
You have already liked this post today
*تعینات کیا مراد ہے مارکیٹ کے تجزیات یہاں ارسال کیے جاتے ہیں جس کا مقصد آپ کی بیداری بڑھانا ہے، لیکن تجارت کرنے کے لئے ہدایات دینا نہیں.


