یہ بھی دیکھیں

 09.06.2025 02:16 PM
In my morning forecast, I focused on the 1.3581 level and planned to base entry decisions around it. Let's look at the 5-minute chart and see what happened. The rise and formation of a false breakout at this level led to an entry point for selling the pound, but a significant decline did not materialize. The technical picture remained unchanged for the second half of the day.

To Open Long Positions on GBP/USD:
The pound has regained all the losses it sustained last Friday, but buyers are once again facing resistance around 1.3581. The absence of U.K. economic statistics didn't help in breaking through this level, so it's better to focus on U.S. data. Upcoming U.S. wholesale inventory data has little impact on forex market dynamics, so attention should be on the ongoing U.S.-China trade talks. In case of strong U.S. data, I would prefer to act around the 1.3544 support level. A false breakout there would provide a good entry point for long positions, aiming for a return to the 1.3581 resistance, where trading is currently concentrated. A breakout and retest from above would create a new entry point for developing a bullish market and targeting 1.3613. The furthest target will be 1.3649, where I plan to lock in profits. If GBP/USD declines and there is no buying activity around 1.3544 in the second half of the day, selling pressure could intensify. In that case, only a false breakout around 1.3507 would provide a suitable condition for opening long positions. Otherwise, I plan to buy on an immediate rebound from the 1.3473 support level, targeting a 30–35 point intraday correction.
To Open Short Positions on GBP/USD:
Sellers didn't even attempt to act today, so the market remains on the side of buyers. Only negative news from the trade negotiations could limit the upward potential of the pair. If GBP/USD surges upward, I plan to act after a false breakout around the 1.3581 resistance, similar to what I described earlier. This would be enough for an entry point for selling, aiming for a decline to the 1.3544 support, where the moving averages favor bulls. A breakout and retest from below would trigger a stop-loss run, opening the way to 1.3507. The furthest target will be 1.3473, where I plan to lock in profits. If demand for the pound persists in the second half of the day and sellers remain inactive around 1.3581, it's better to wait for a test of the 1.3613 resistance. I would only open short positions there after a failed breakout. If no downward movement occurs there either, I'll look for short positions on a rebound from 1.3649, but only targeting a 30–35 point correction.

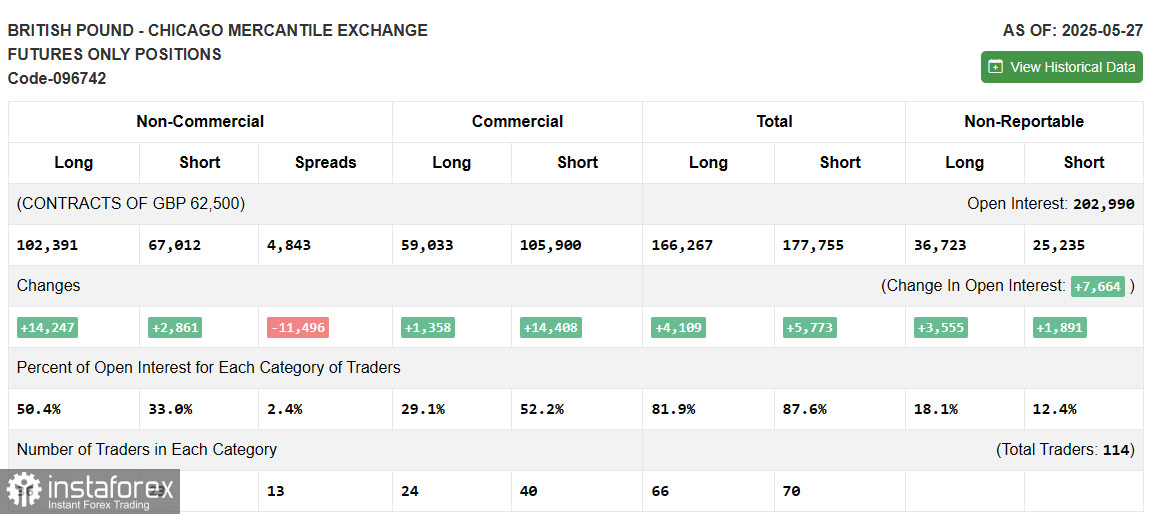
The COT (Commitment of Traders) report from May 27 showed a sharp increase in long positions and a less active rise in short positions. After the U.K. and the U.S. signed a trade agreement, demand for the pound has remained strong. Considering that the Bank of England is staying on the sidelines and not intervening in monetary policy, the pound has a decent chance of further strengthening. Add to this the ongoing U.S.-China trade tensions and the weakness of the U.S. dollar, and it becomes clear that the medium-term bullish trend for the pound is not yet over. There are no major U.K. statistics scheduled soon, meaning fewer reasons for major players to sell the pound. The latest COT report indicated that long non-commercial positions increased by 14,247 to 102,391, while short positions rose by 2,861 to 67,012. As a result, the gap between long and short positions narrowed by 11,469.
Indicator Signals:
Moving Averages Trading is taking place above the 30- and 50-day moving averages, indicating continued growth for the pair.Note: The period and prices of the moving averages are considered by the author on the hourly H1 chart and differ from the standard definition of classical daily moving averages on the D1 chart.
Bollinger Bands In case of a decline, the lower boundary of the indicator around 1.3507 will act as support.
Indicator Descriptions:


