یہ بھی دیکھیں

 13.06.2025 06:31 AM
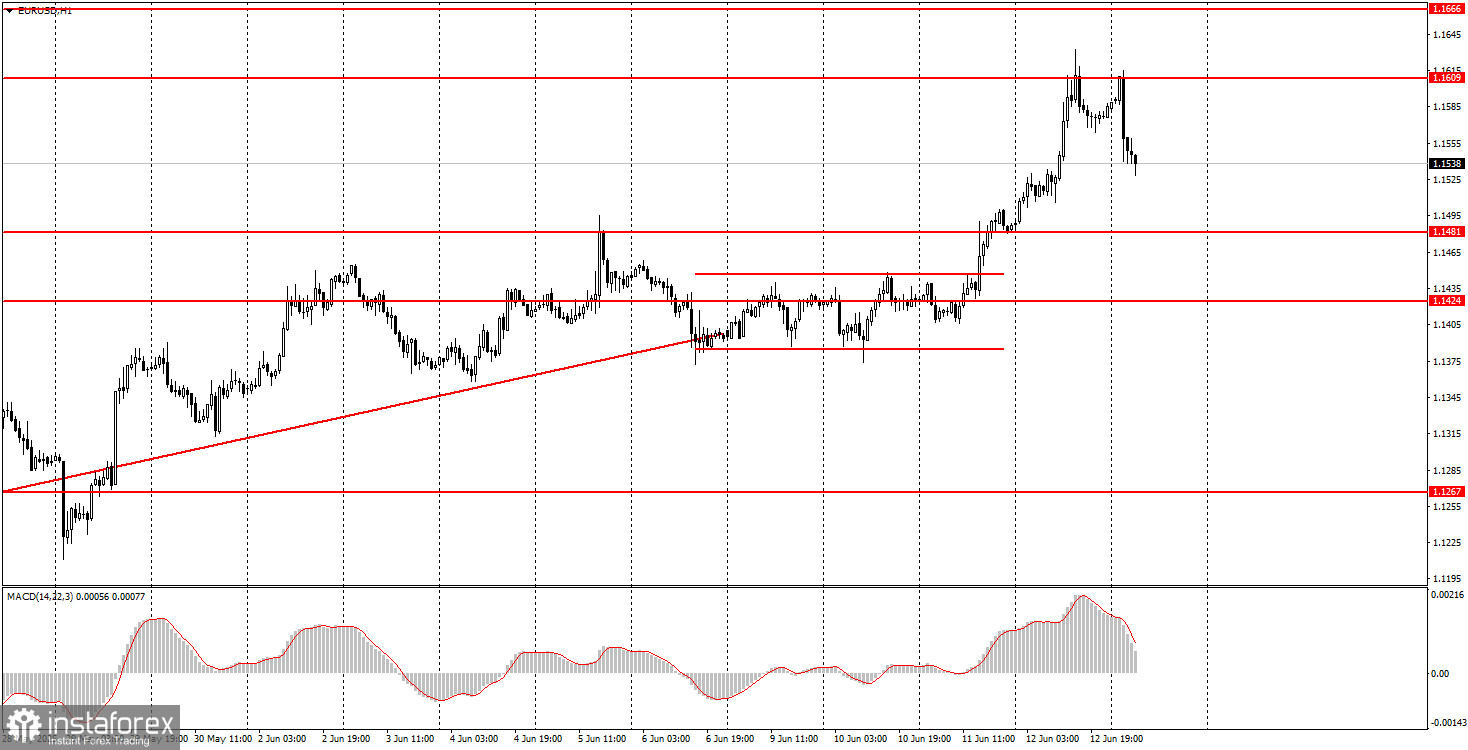
The EUR/USD currency pair on Thursday and during the night into Friday exhibited "American-style racing." Over the past two days, the U.S. dollar has once again plummeted as mass protests and riots continue across many American cities in response to Donald Trump's immigration policy. Meanwhile, Trump announced his intention to escalate tensions by increasing trade tariffs on all countries included on his "blacklist." Therefore, it's unsurprising that the dollar is again under intense pressure.
However, last night, Israel launched a massive missile strike on Iran, targeting its military and nuclear facilities. Iranian officials have already declared they are preparing a retaliatory strike. As a result, tensions in the Middle East have escalated, prompting traders to rush into buying the "safe-haven" U.S. dollar. Still, the dollar was considered a safe haven in the past, so the overnight buying likely reflects old habits. We do not believe this dollar strength will be systematic or long-lasting.
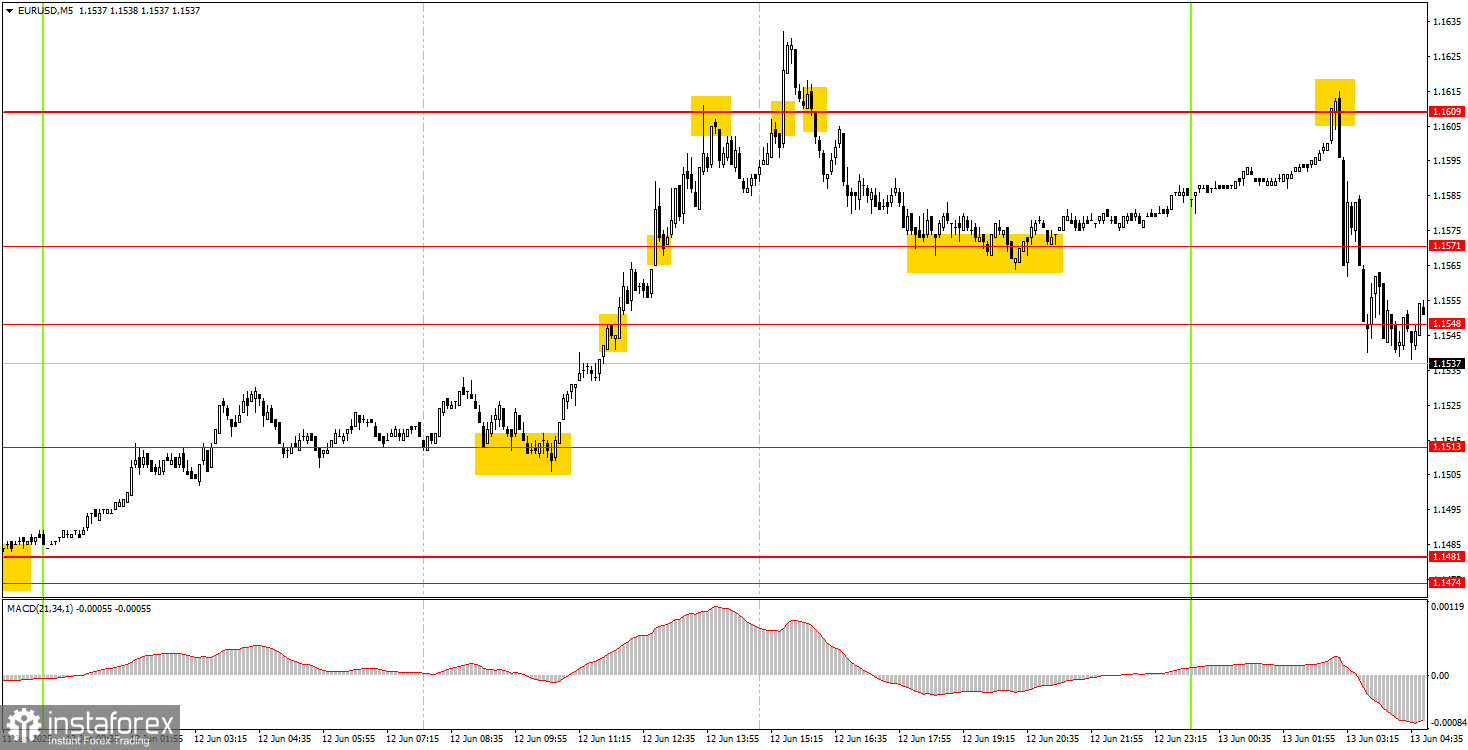
On Thursday, a large number of trading signals formed on the 5-minute timeframe due to the strong and trending market movements. The euro could have been bought early in the morning following a bounce from the 1.1513 level. Short positions could have been closed around the 1.1609 level. Next came a false buy signal near 1.1609, followed by a valid sell signal, which ended near 1.1571. Thus, two out of three trades yielded significant profit. Overnight, the price rebounded perfectly from 1.1609, leading to a strong decline.
In the hourly chart, the EUR/USD pair continues its uptrend, which began under Trump's leadership. In fact, the very fact that Trump is President of the United States remains enough reason for the market to flee the dollar without hesitation. Trump keeps issuing threats, setting ultimatums, imposing and increasing tariffs, and making other controversial decisions. As a result, even if the market isn't selling the dollar daily, it certainly has no intention of buying it for the medium term.
As for Friday, it's very difficult to predict what to expect from the dollar. A new conflict between Iran and Israel has broken out, which could support the dollar. On the other hand, Trump's aggressive trade actions could weigh heavily on the greenback.
On the 5-minute TF, we should consider the levels of 1.1132-1.1140, 1.1198-1.1218, 1.1267-1.1292, 1.1354-1.1363, 1.1413-1.1424, 1.1474-1.1481, 1.1513, 1.1548, 1.1571, 1.1609, 1.1666, 1.1704, 1.1802. Fundamentals on Friday are weak both in the EU and the U.S., but who is paying attention to macroeconomic reports at this point? It looks like we are in for another market storm — one that has already begun.
Support and Resistance Levels: These are target levels for opening or closing positions and can also serve as points for placing Take Profit orders.
Red Lines: Channels or trendlines indicating the current trend and the preferred direction for trading.
MACD Indicator (14,22,3): A histogram and signal line used as a supplementary source of trading signals.
Important Events and Reports: Found in the economic calendar, these can heavily influence price movements. Exercise caution or exit the market during their release to avoid sharp reversals.
Forex trading beginners should remember that not every trade will be profitable. Developing a clear strategy and practicing proper money management are essential for long-term trading success.


