یہ بھی دیکھیں

 23.06.2025 11:38 AM
This week, from the 1.3446 level (closing of the last weekly candle), the price may continue to decline toward the target of 1.3256 — the 23.6% pullback level (red dashed line). Upon testing this level, the price may start moving upward toward the 13 EMA at 1.3317 (thin yellow line).
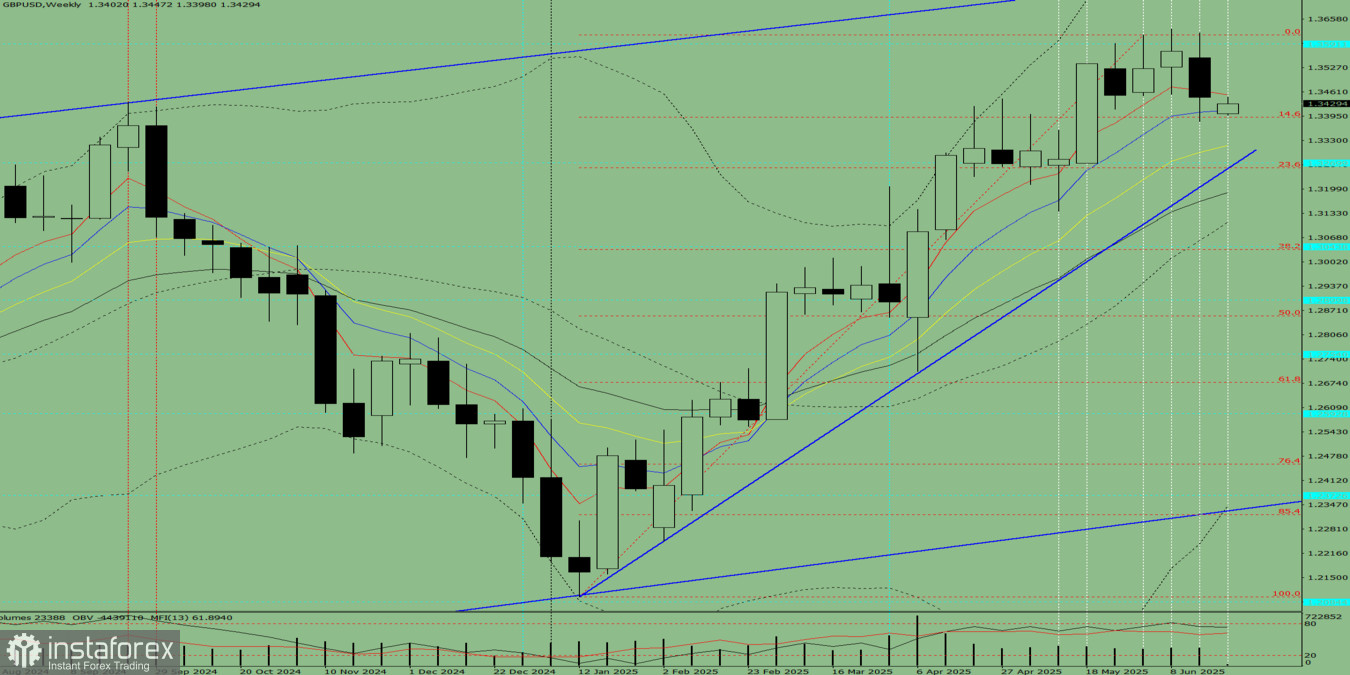
Figure 1 (Weekly Chart)
A downward movement is expected.
The price is likely to follow a downward trend throughout the week, forming a weekly black (bearish) candle without an upper shadow (Monday – down), and with a lower shadow (Friday – up).
From the 1.3446 level (closing of the last weekly candle), the price may continue to decline toward the 13 EMA at 1.3317 (thin yellow line). Upon reaching this line, a rebound to the upside is possible with a target of 1.3392 — the 14.6% pullback level (red dashed line).
You have already liked this post today
*تعینات کیا مراد ہے مارکیٹ کے تجزیات یہاں ارسال کیے جاتے ہیں جس کا مقصد آپ کی بیداری بڑھانا ہے، لیکن تجارت کرنے کے لئے ہدایات دینا نہیں.


