یہ بھی دیکھیں

 04.07.2025 03:56 AM
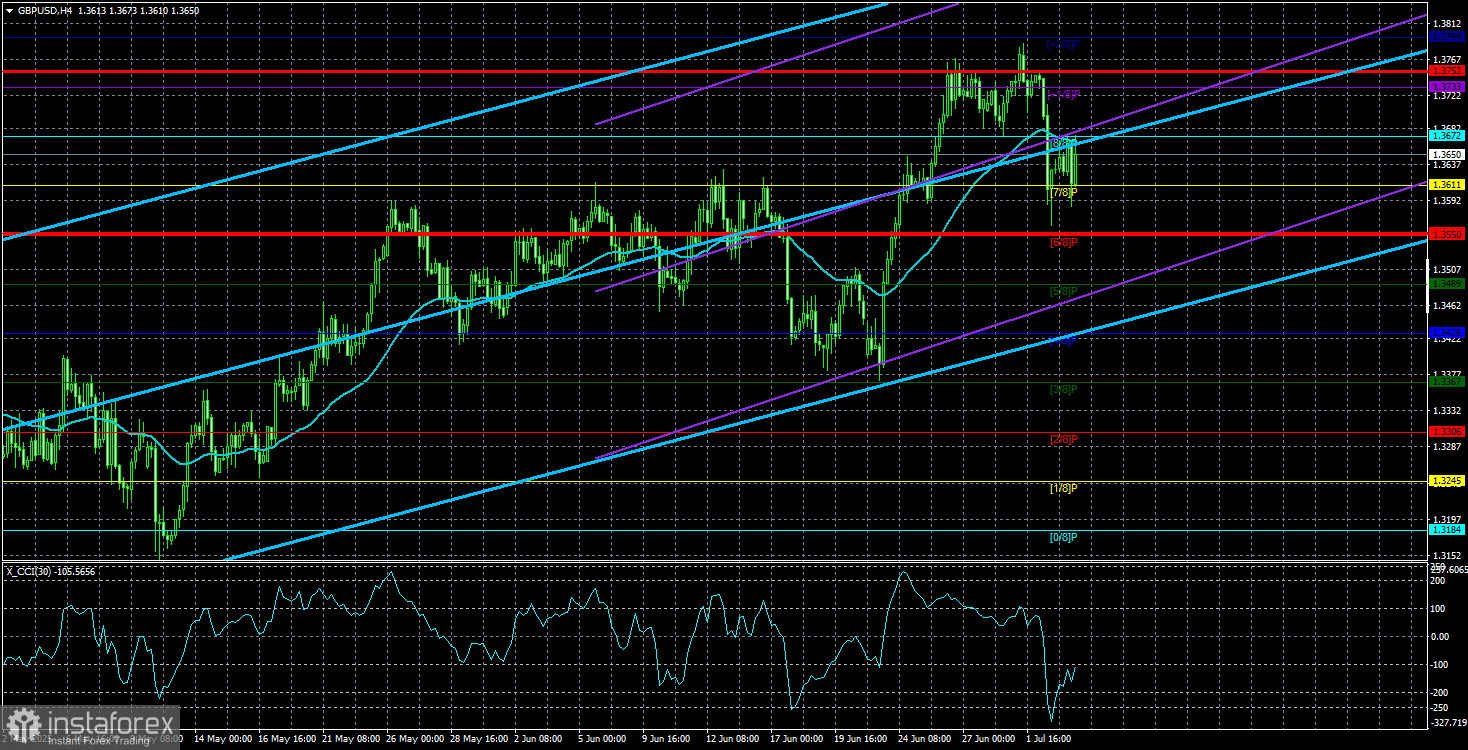
The GBP/USD currency pair also traded fairly calmly throughout Thursday until the start of the U.S. trading session. Recall that a day earlier, the British currency had plummeted by nearly 200 pips. Yet within the next 12 hours, the pound recovered by 100 pips. Thus, first, its losses turned out to be minimal. Second, there were no objective reasons for such a sharp fall in the pound. Third, the global fundamental backdrop had not changed in a way that would justify a drop in the pound or a rise in the dollar.
It turned out that the UK Chancellor of the Exchequer, Rachel Reeves, was brought to tears during a speech by Prime Minister Keir Starmer in Parliament. The question is, did anyone react to Reeves's tears by launching a massive sell-off of the pound, which had been gaining for five consecutive months? Does anyone honestly believe that Reeves' crying is a sufficient reason for a total pound sell-off?
From our perspective, this was a textbook case of manipulation by market makers. They waited for a formal excuse and drove the GBP/USD pair downward. Why? The answer is likely this: to buy in later at more favorable prices and collect liquidity from all the traders whose Stop Loss orders were triggered in the price range covered on Wednesday. Predictably, the media blew the situation out of proportion, reporting that Reeves might resign. Bond yields surged, and Keir Starmer had to calm the "audience," assuring them that the Chancellor cried for personal reasons and that he fully trusts and highly values her work.
What should be evaluated is not the Chancellor's tears, but the results of the government, the Treasury, or the central bank. If the outcomes are positive, then what does it matter why Reeves cried? If they are negative, are we to believe that the market needed Reeves's tears to finally grasp the seriousness of the situation? That would be absurd.
We believe that the British pound will recover, and there are currently far more important global topics to discuss and react to than Reeves's emotional response. What has changed for the U.S. dollar because of this situation? Absolutely nothing. If the market has been dumping the dollar for five months due to Donald Trump's policies, is it now suddenly going to buy it because the UK may need to raise taxes? In the U.S., taxes may be lowered, but Americans will end up paying more for imported goods, and 11 million people will lose access to subsidized or free healthcare. In the grand scheme of things, tax increases in the UK do not look all that terrible.
Is there a budget deficit in the UK? In the U.S., budget deficits occur every year, and Trump easily signs a "big bill" that will increase national debt by $3 trillion. If the budget is running a surplus, should the national debt be rising or falling?
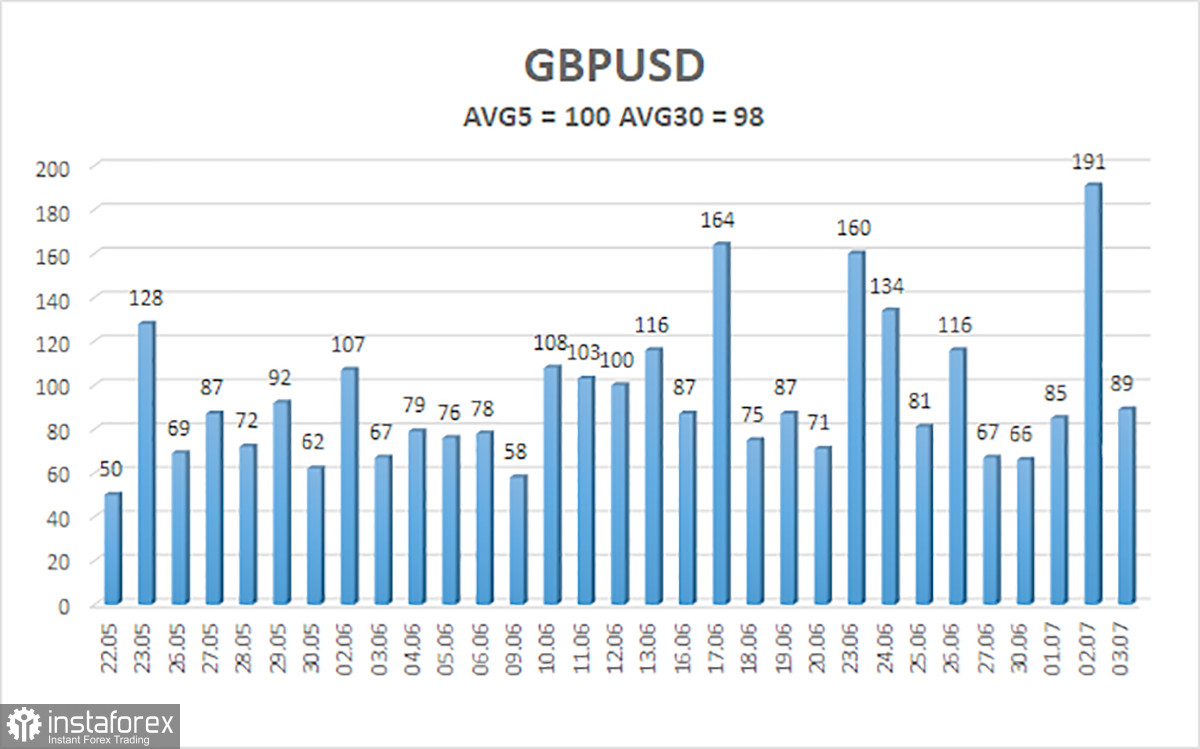
The average volatility of the GBP/USD pair over the last five trading days is 100 pips. For the pound/dollar pair, this is considered "moderate." Therefore, on Friday, July 4, we expect movement within a range limited by 1.3552 and 1.3752. The long-term regression channel is pointing upward, indicating a clear uptrend. The CCI indicator has entered oversold territory for the second time recently, again signaling the resumption of the uptrend.
S1 – 1.3611
S2 – 1.3550
S3 – 1.3489
R1 – 1.3672
R2 – 1.3733
R3 – 1.3794
The GBP/USD currency pair has initiated a mild correction, which may conclude soon. In the medium term, Trump's policies are likely to continue to pressure the dollar. Therefore, long positions with targets at 1.3733 and 1.3752 remain relevant as long as the price is above the moving average. If the price falls below the moving average, small short positions with targets at 1.3552 and 1.3550 may be considered. However, as before, we do not expect significant dollar growth. The U.S. currency may show occasional corrections, but for a strong rally, real signs of an end to the global trade war are needed.
Linear Regression Channels help determine the current trend. If both channels are aligned, it indicates a strong trend.
Moving Average Line (settings: 20,0, smoothed) defines the short-term trend and guides the trading direction.
Murray Levels act as target levels for movements and corrections.
Volatility Levels (red lines) represent the likely price range for the pair over the next 24 hours based on current volatility readings.
CCI Indicator: If it enters the oversold region (below -250) or overbought region (above +250), it signals an impending trend reversal in the opposite direction.


