یہ بھی دیکھیں

 07.07.2025 06:24 AM
On the weekly chart, the price has precisely reached the intersection point of the Fibonacci ray and the upper boundary of the price channel. This occurred on the first bar after the 11th Fibonacci time line — a point which, in most cases, marks the beginning of a trend reversal. The divergence between the price and the Marlin oscillator further reinforces this signal.
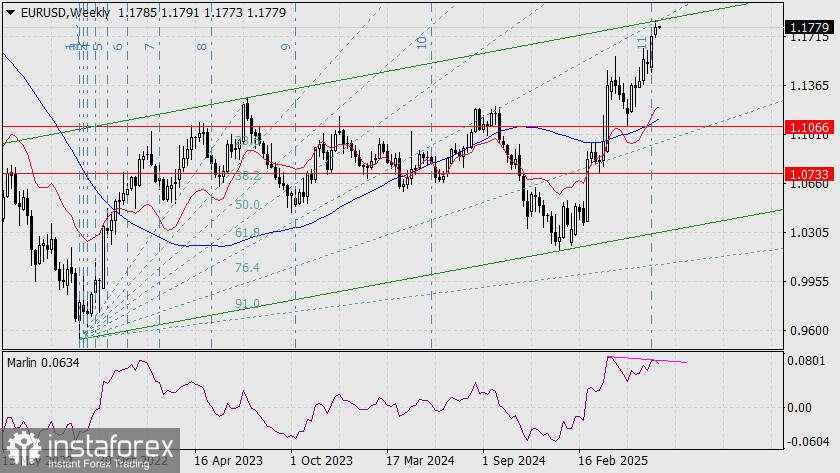
Statistically, movements of this type tend to span two ranges of the Fibonacci fan, which in this case could bring the price down to the 1.0179 level — the January low.
On the daily chart, the price is consolidating and waiting for a catalyst.
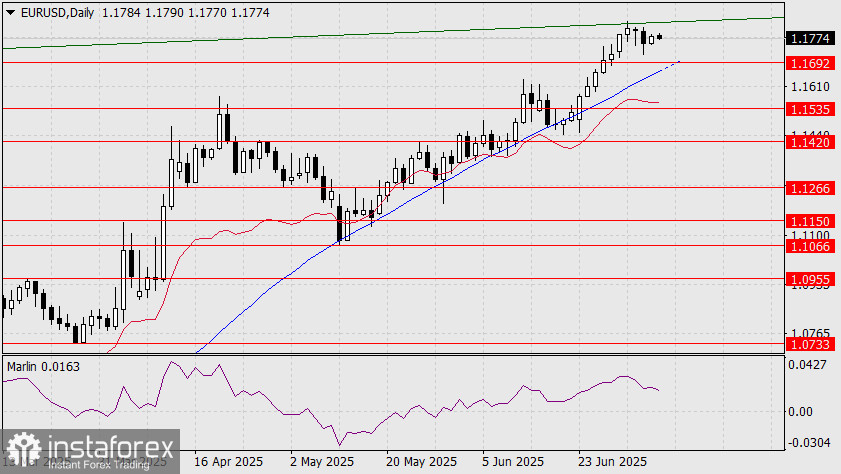
Such a catalyst may come today from Germany's industrial production data (forecast: –0.6% for May) and eurozone retail sales (forecast: –0.8% for May). The Marlin oscillator is also indicating a strengthening bearish trend. A break below the 1.1692 support level could occur on Tuesday or Wednesday, which would also mean a breach of the MACD line support. This would open the path toward the 1.1535 target.
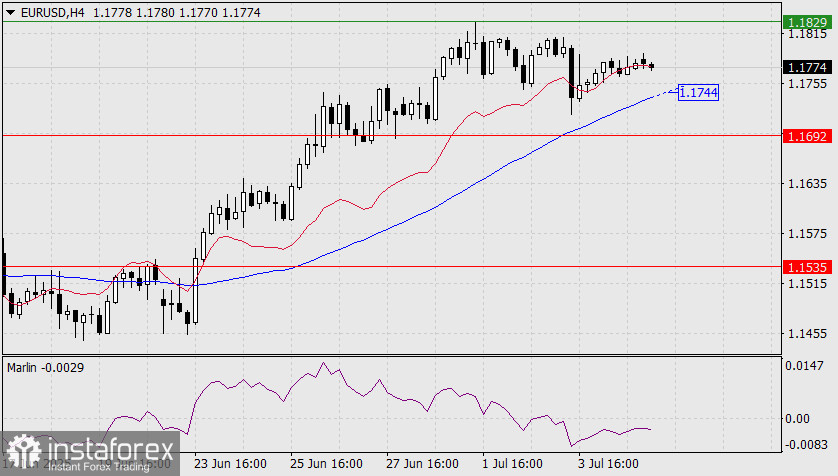
On the H4 chart, the price remains close to the balance line and is attempting a natural approach toward the MACD line (1.1744) to break through its support. A firm move below this level would lead to price consolidation in preparation for a breakout under 1.1692.
You have already liked this post today
*تعینات کیا مراد ہے مارکیٹ کے تجزیات یہاں ارسال کیے جاتے ہیں جس کا مقصد آپ کی بیداری بڑھانا ہے، لیکن تجارت کرنے کے لئے ہدایات دینا نہیں.


