یہ بھی دیکھیں

 18.07.2025 06:13 AM
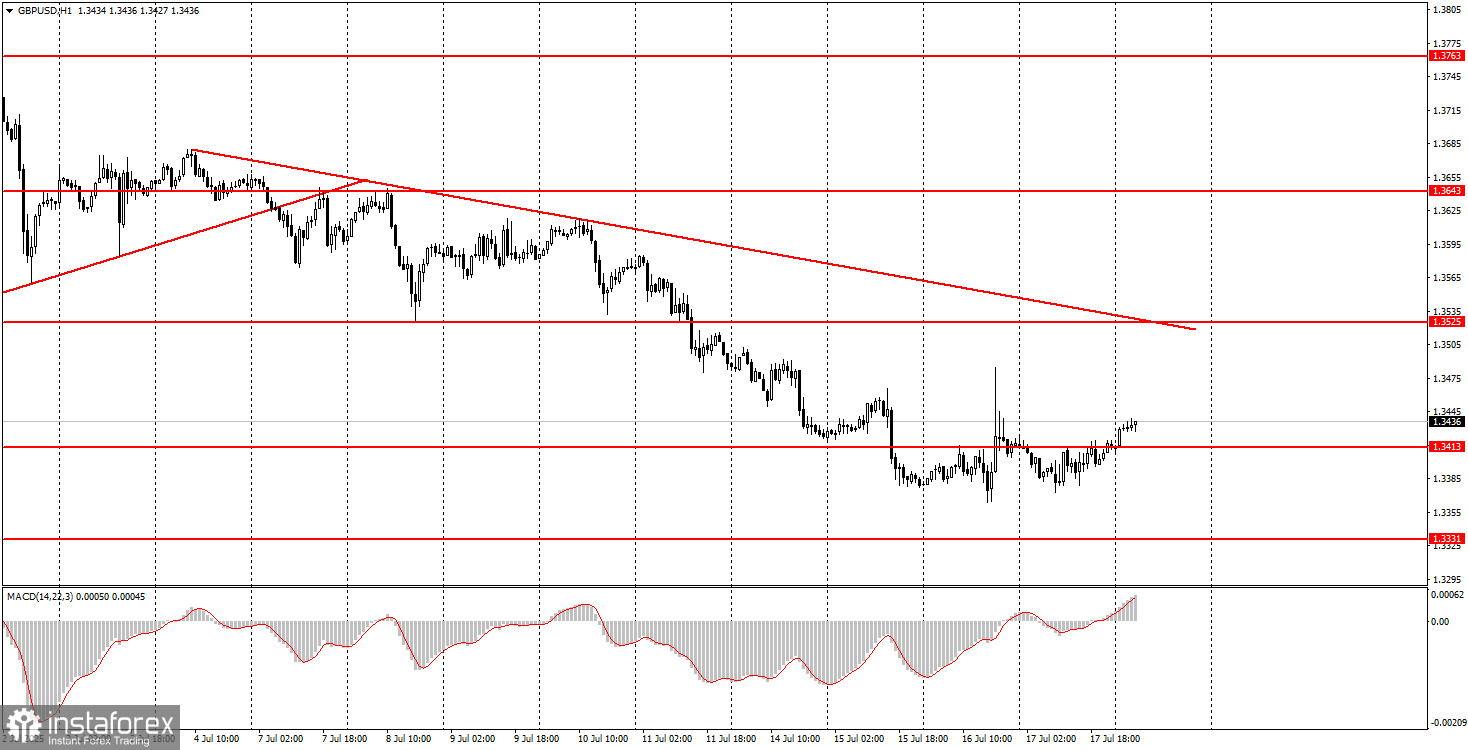
On Thursday, the GBP/USD pair also traded with minimal volatility. Strangely enough, there was quite a lot of interesting data released yesterday regarding both the British pound and the U.S. dollar, but as we've already mentioned, the market is currently trading by its own rules.
Let us recall that earlier in the week, we saw a strong dollar rally despite a rather bland U.S. inflation report, a complete disregard for the highly significant UK inflation report, a "storm" after yet another round of rumors about Jerome Powell's dismissal, and a complete disregard for the poor UK unemployment data.
Thus, we continue to believe that the recent decline in the pair is purely a technical correction. Why is it needed? So that the market — and specifically the market makers — can lock in some profit from long positions and start forming new long positions. In our view, the "2025 trend" will continue. A break above the trendline would signal a short-term reversal of the trend.
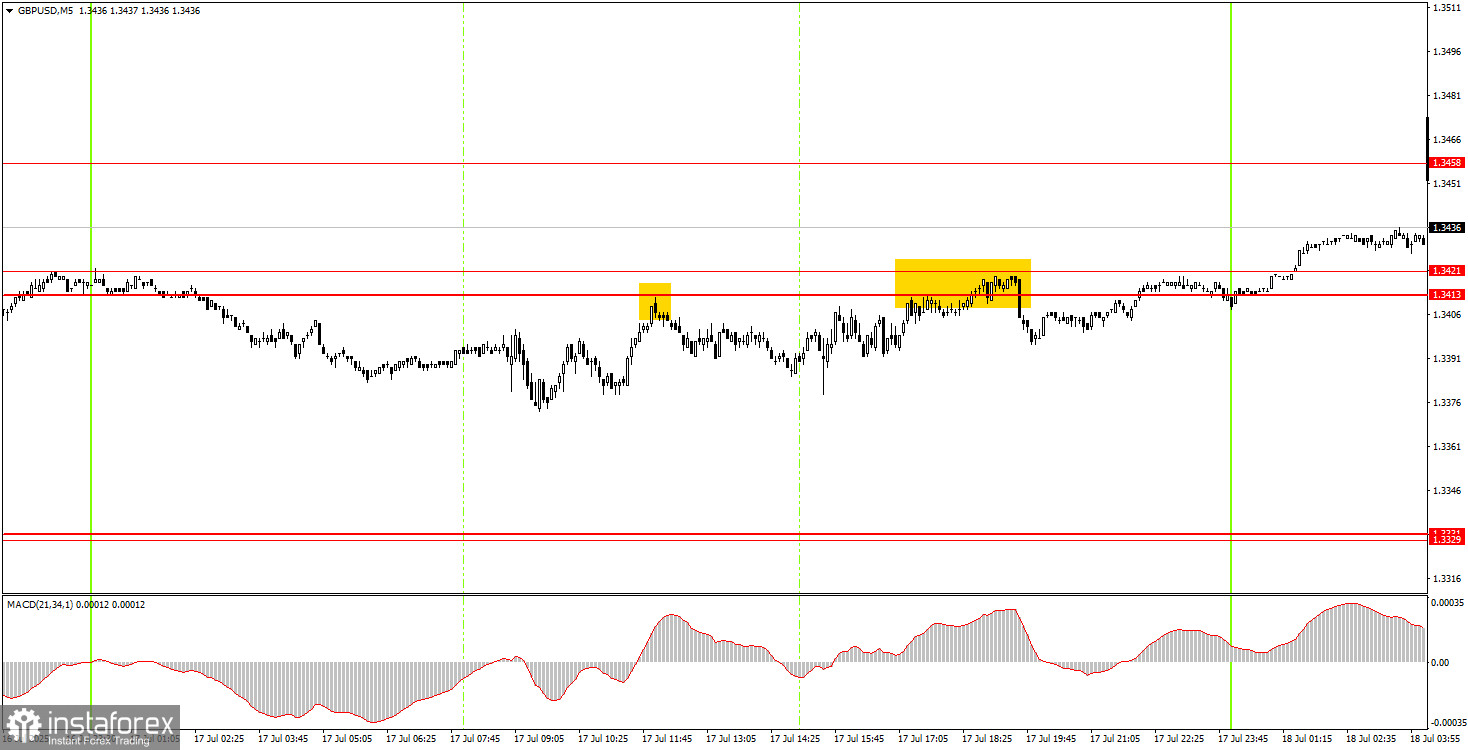
On the 5-minute timeframe, two sell signals were formed on Thursday. The price twice rebounded from the 1.3413–1.3421 zone, but failed to produce any meaningful movement. It also did not consolidate above the 1.3413–1.3421 area. Therefore, novice traders may have opened short positions, but they resulted in neither profit nor loss.
On the hourly timeframe, the GBP/USD pair remains in a downward trend. We believe the current downward move is a pure technical correction, as there are still no fundamental reasons for the dollar's strength. Nevertheless, the market may act based on technical factors, which is precisely what we're observing now. Until the price consolidates above the trendline, there is no technical justification for resuming the six-month upward trend.
On Friday, the GBP/USD pair could still resume its decline, but we don't expect strong bullish or bearish drivers on the last trading day of the week — unless, of course, Trump announces new tariffs or "fires Powell" for the twentieth time.
On the 5-minute timeframe, trading can now be conducted using the following levels: 1.3203–1.3211, 1.3259, 1.3329–1.3331, 1.3413–1.3421, 1.3458, 1.3518–1.3525, 1.3574–1.3590, 1.3643–1.3652, 1.3682, 1.3763, 1.3814–1.3832.
On Friday, the UK economic calendar is empty, while in the U.S., the only notable release is the University of Michigan Consumer Sentiment Index. Although it's an interesting indicator, it's unlikely to provoke a strong market reaction.
Support and Resistance Levels: These are target levels for opening or closing positions and can also serve as points for placing Take Profit orders.
Red Lines: Channels or trendlines indicating the current trend and the preferred direction for trading.
MACD Indicator (14,22,3): A histogram and signal line used as a supplementary source of trading signals.
Important Events and Reports: Found in the economic calendar, these can heavily influence price movements. Exercise caution or exit the market during their release to avoid sharp reversals.
Forex trading beginners should remember that not every trade will be profitable. Developing a clear strategy and practicing proper money management are essential for long-term trading success.


