یہ بھی دیکھیں

 22.07.2025 03:45 AM
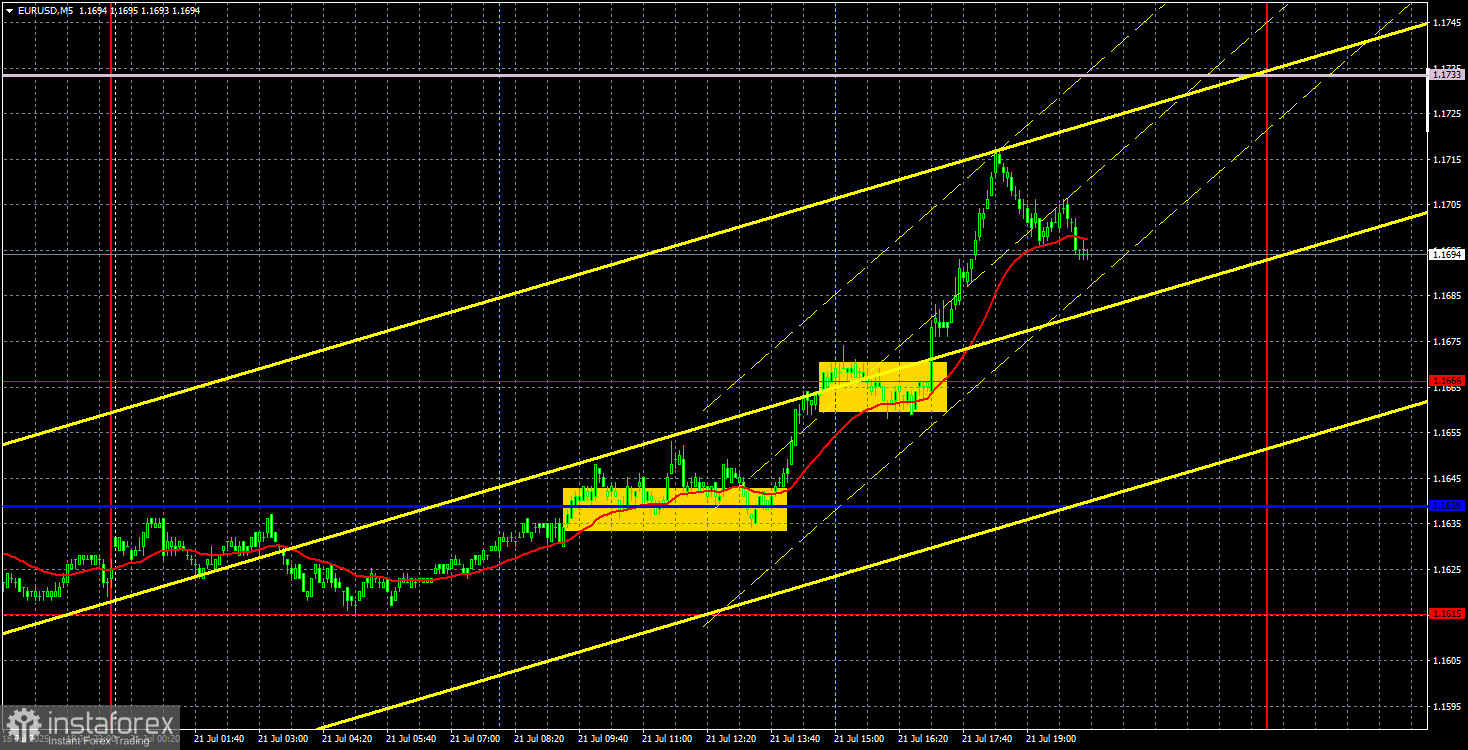
On Monday, the EUR/USD currency pair continued its upward movement, which began last week. There were no local macroeconomic reasons for the euro's rise, but there were plenty of fundamental ones. Recall that for two weeks, the market had been stubbornly ignoring the imposition of new trade tariffs initiated by Donald Trump. We had warned that this factor would likely come into play—but only after the completion of a purely technical correction. And indeed, on Sunday, Trump announced his intention to raise baseline tariffs on the European Union to 15–20%, and only after that proceed with trade negotiations. In other words, traders once again faced an abrupt and inexplicable tariff hike at the worst possible time—simply because the U.S. president wanted it. As a result, the dollar finally began its long-overdue decline.
From a technical perspective, everything also looks entirely logical. On the higher timeframes, the upward trend remains intact. On the hourly timeframe, it was necessary to wait for the technical correction to end. Yesterday, the price consolidated above the descending channel and above the critical line. The only significant resistance left is the Senkou Span B line. Thus, we believe the dollar will resume its decline in the medium term.
On the 5-minute chart, it is visible that the pair spent the entire day in an upward move. Two trading signals were generated. First, the pair somewhat inaccurately broke through the Kijun-sen line, and then just as tentatively—through the 1.1666 level. The first signal provided a long entry, which remained valid for almost the entire day. These long positions could have been closed nearly anywhere, since no sell signals were generated at all.
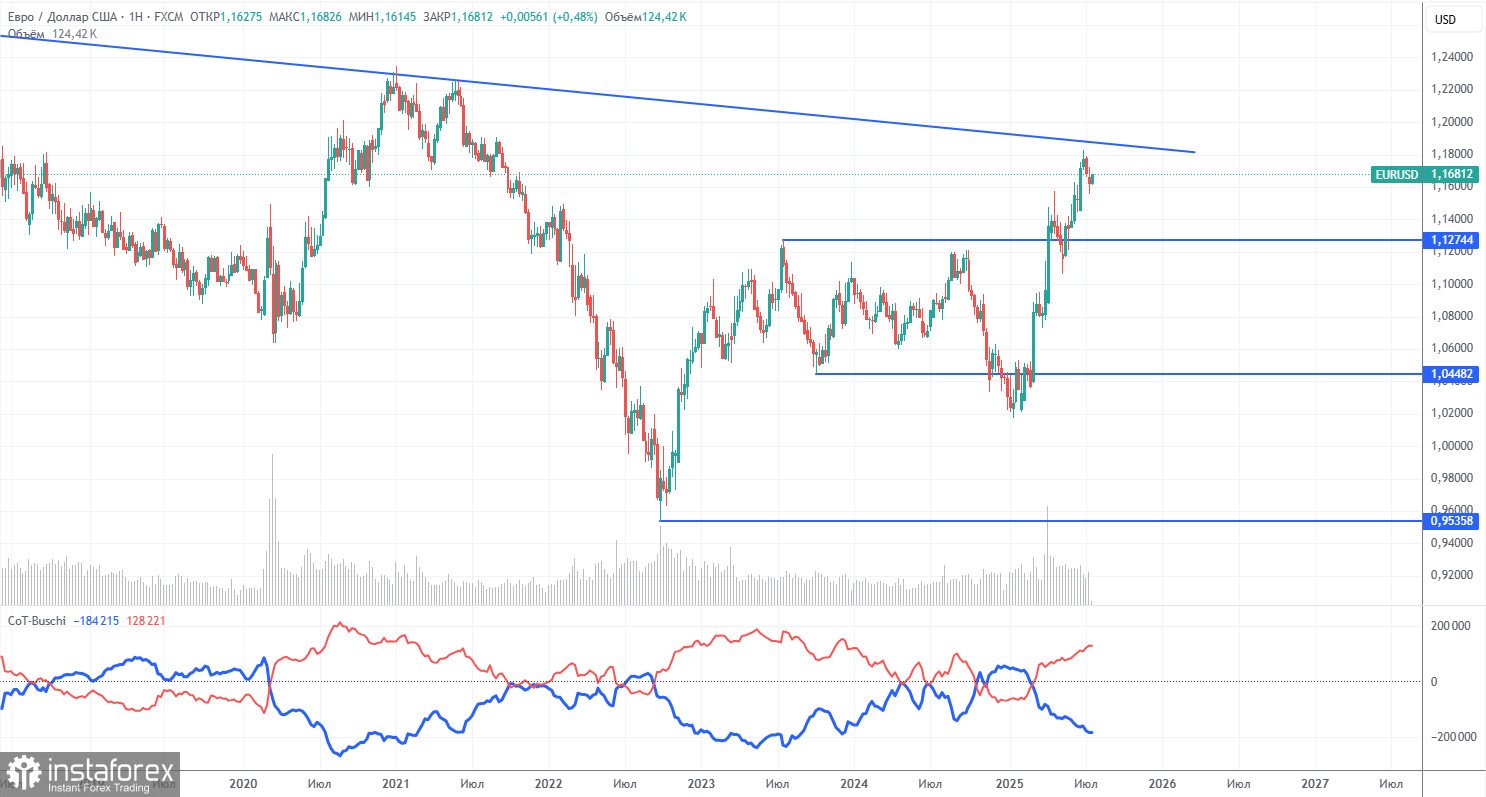
The latest COT report is dated July 15. As shown in the chart above, the net position of non-commercial traders had been bullish for a long time. Bears only barely gained the upper hand at the end of 2024—and then quickly lost it. Since Trump took office, the dollar has been the only currency to fall. While we can't say with 100% certainty that the U.S. currency will continue to decline, current global developments suggest that scenario.
We still do not see any fundamental reasons for the strengthening of the euro; however, one very strong factor remains for the dollar's continued decline. The global downtrend persists—but does it matter now where the price has moved over the past 16 years? Once Trump ends his trade wars, the dollar may resume growth—but will Trump ever end them? And when?
The position of the red and blue indicator lines still points to a bullish trend. During the latest reporting week, the number of long positions in the "Non-commercial" group increased by 1,000 contracts, while short positions decreased by 6,600. As a result, the net position increased by 7,600 contracts.
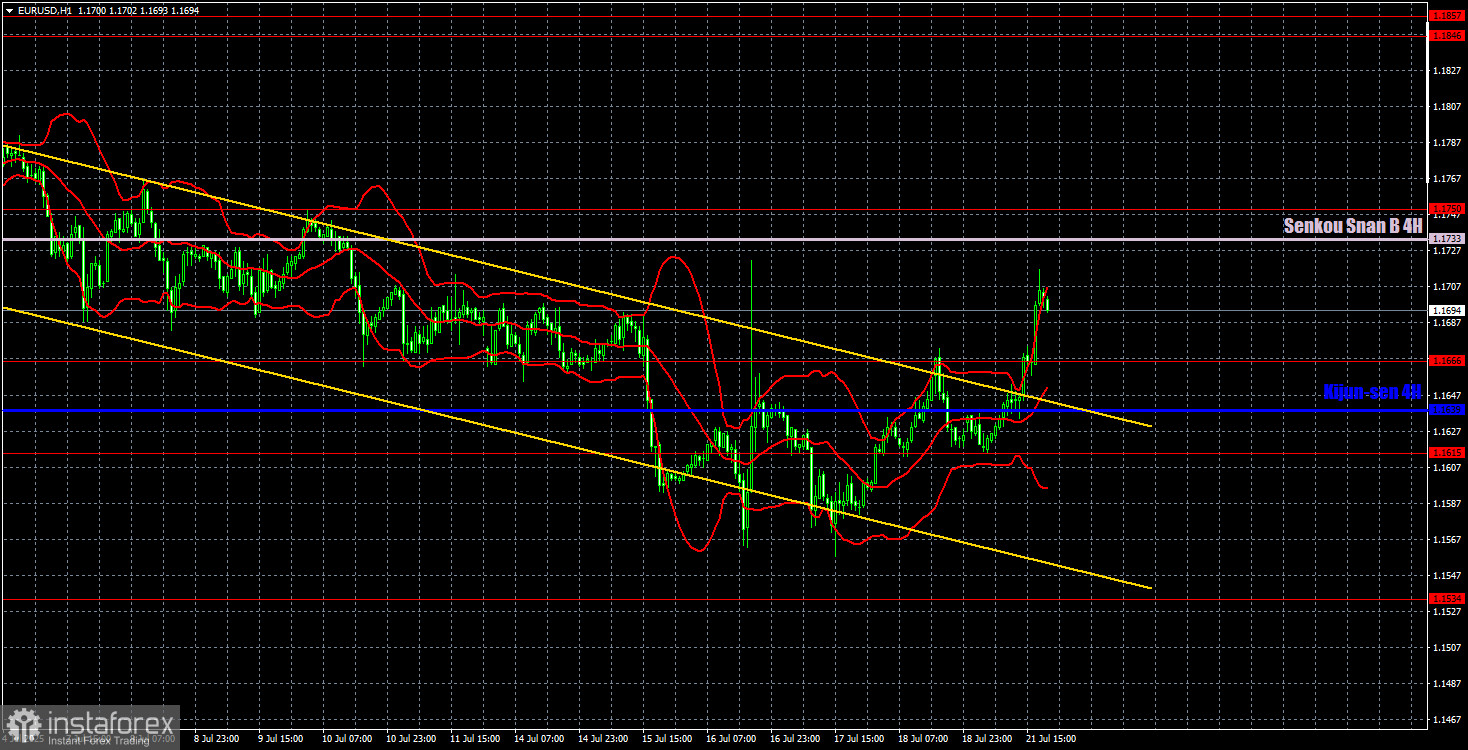
On the hourly timeframe, the EUR/USD pair has completed its downward trend. Trump continues to raise tariffs and impose new ones, while the likelihood of trade deals being signed grows slimmer by the day. Without such deals, the trade war will escalate further—a negative factor for the dollar.
For July 22, we highlight the following trading levels: 1.1092, 1.1147, 1.1185, 1.1234, 1.1274, 1.1362, 1.1426, 1.1534, 1.1615, 1.1666, 1.1750, 1.1846–1.1857, as well as the Senkou Span B (1.1733) and Kijun-sen (1.1639) lines. Note that the Ichimoku indicator lines may shift during the day, so this should be taken into account when identifying trading signals. Don't forget to move the Stop Loss to breakeven once the price moves 15 pips in the correct direction. This protects against potential losses in case of a false signal.
There are no significant events or reports scheduled in the eurozone on Tuesday, but in the U.S., Federal Reserve Chair (still) Jerome Powell will speak. We don't expect any major announcements from him, but the ongoing conflict between Powell and Trump is now just as important as the trade war itself. The Fed may not only lose its chair, but also its independence.


