یہ بھی دیکھیں

 04.08.2025 12:00 PM
Trend Analysis
In August, the price from the level of 1.1414 (closing of the July monthly candle) may begin to move upward toward the target of 1.1710 – historical resistance level (blue dashed line). From this level, a corrective downward movement may follow, targeting 1.1588 – the 14.6% retracement level (yellow dashed line).
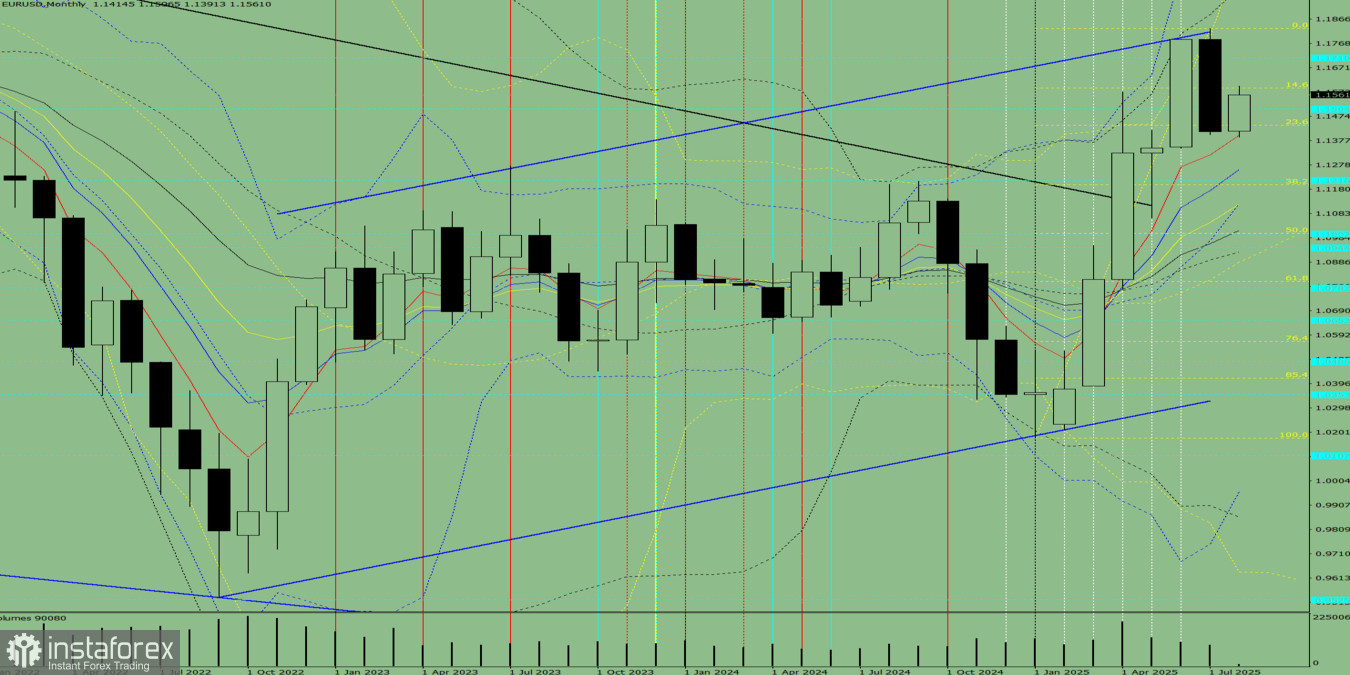
Fig. 1 (Monthly Chart)
Indicator Analysis:
Conclusion based on comprehensive analysis: a possible upward trend.
General forecast for the EUR/USD monthly candle: The price is likely to follow an upward trend, with no lower shadow on the monthly white candle (first week of the month – bullish) and the presence of an upper shadow (last week of the month – bearish).
Alternative Scenario: From the level of 1.1414 (closing of the July monthly candle), the price may begin an upward movement toward the target of 1.1829 – upper fractal (yellow dashed line). From that level, a downward move toward 1.1710 – historical resistance level (blue dashed line) is possible.
You have already liked this post today
*تعینات کیا مراد ہے مارکیٹ کے تجزیات یہاں ارسال کیے جاتے ہیں جس کا مقصد آپ کی بیداری بڑھانا ہے، لیکن تجارت کرنے کے لئے ہدایات دینا نہیں.


