یہ بھی دیکھیں

 14.08.2025 03:52 AM
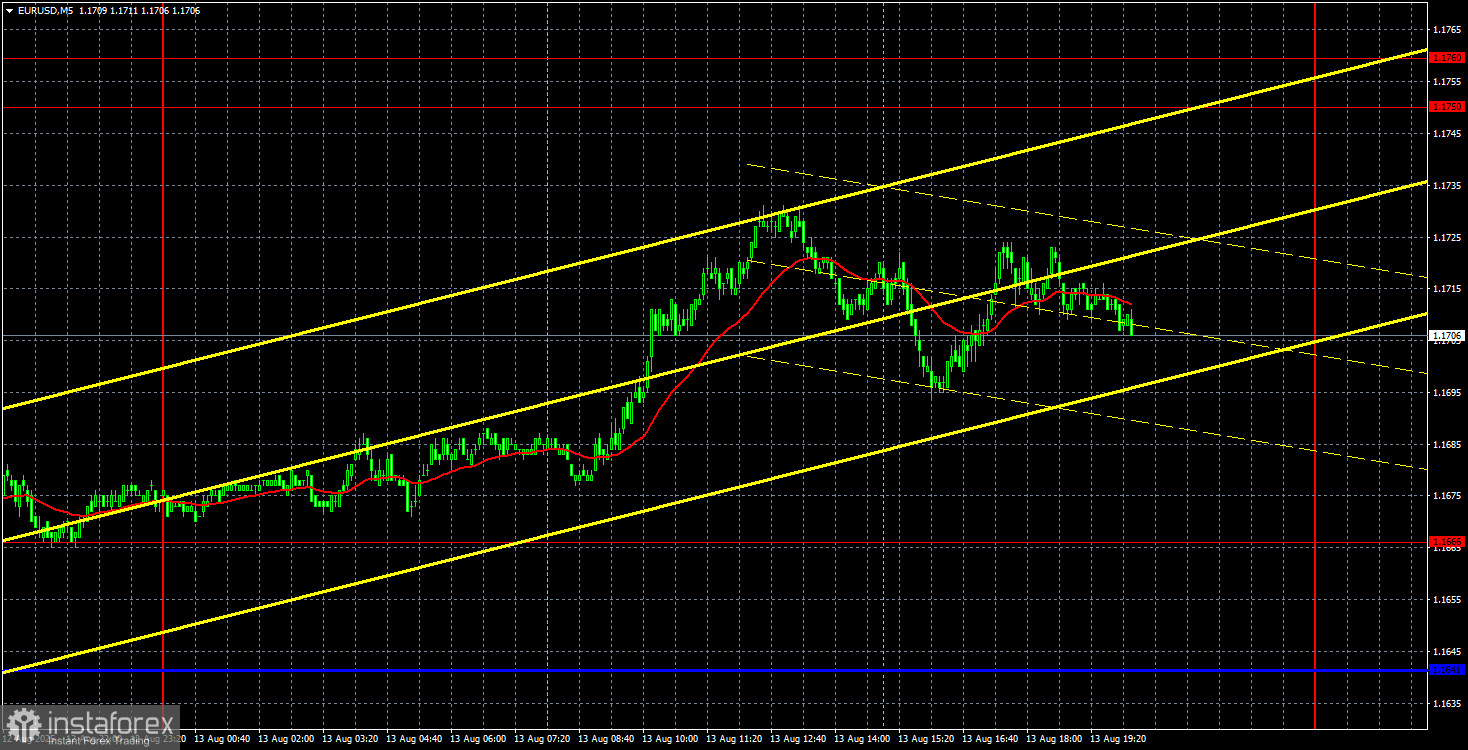
On Wednesday, the EUR/USD currency pair continued its upward movement, despite the absence of any important events or reports during the day. However, the broader fundamental backdrop — driven by the same persistent factors — continues to exert constant pressure on the U.S. dollar. Thus, for the dollar to experience another decline, no local news or macroeconomic reports are needed, as we could see on Wednesday.
From a technical perspective, we are dealing with another upward trend, which is almost certainly part of the "2025 trend." Therefore, we expect the bullish movement to continue further. Two new global themes are looming for the dollar, both of which could create additional problems for it. The first is the high likelihood of deep monetary policy easing by the Federal Reserve. The second is the upcoming talks in Alaska, which could lead to at least a temporary ceasefire. Both factors are negative for the dollar — the Fed's monetary policy for obvious reasons, and the de-escalation of the conflict in Ukraine, as it would favor riskier currencies rather than the safe-haven dollar.
In the 5-minute time frame yesterday, no trading signals were formed. The last signal appeared on Tuesday evening, when the price bounced twice from the 1.1666 level. In theory, these signals could have been traded, at least at the opening of the European session on Wednesday, as the price had not moved far from the signal point at that time. We expect growth toward the 1.1750–1.1760 area.
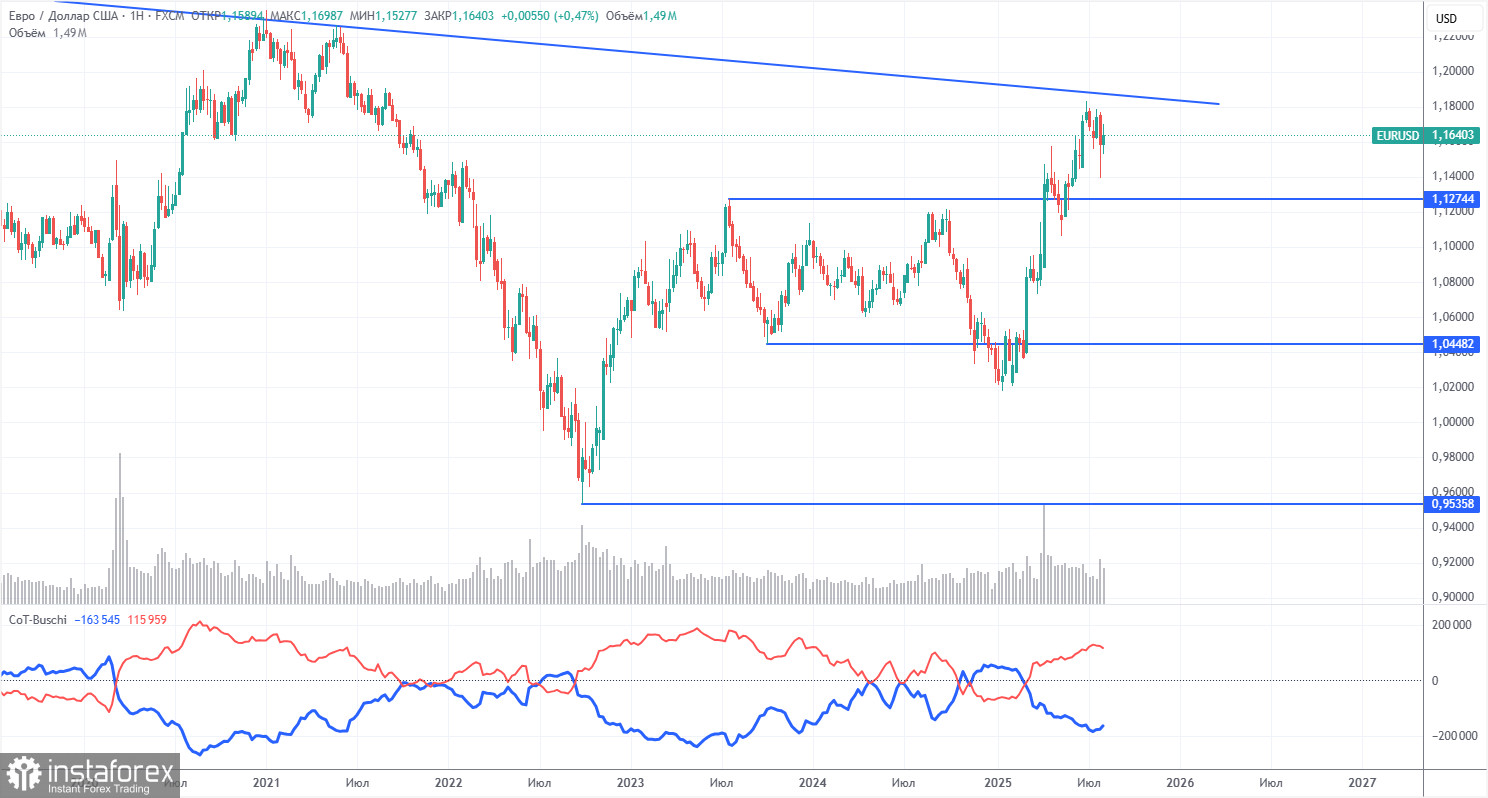
The latest COT report is dated August 5. As the chart above clearly shows, the net position of non-commercial traders had been bullish for a long time, while bears barely entered the dominance zone at the end of 2024 but quickly lost it. Since Donald Trump took office, the dollar has only been falling. We cannot say with 100% certainty that the decline of the U.S. currency will continue, but current global developments point precisely in that direction.
We still see no fundamental factors for strengthening the euro, but there remains one very significant factor for the dollar's decline. The long-term downtrend remains intact, but at this point, what does it matter where the price has moved over the past 17 years? Once Trump ends his trade wars, the dollar may start to rise, but recent events have shown that the war will continue in one form or another.
The positioning of the red and blue indicator lines still signals a bullish trend. During the last reporting week, the number of long positions among the "Non-commercial" group decreased by 1,400, while short positions increased by 5,900. As a result, the net position fell by 7,300 contracts over the week — an insignificant change.
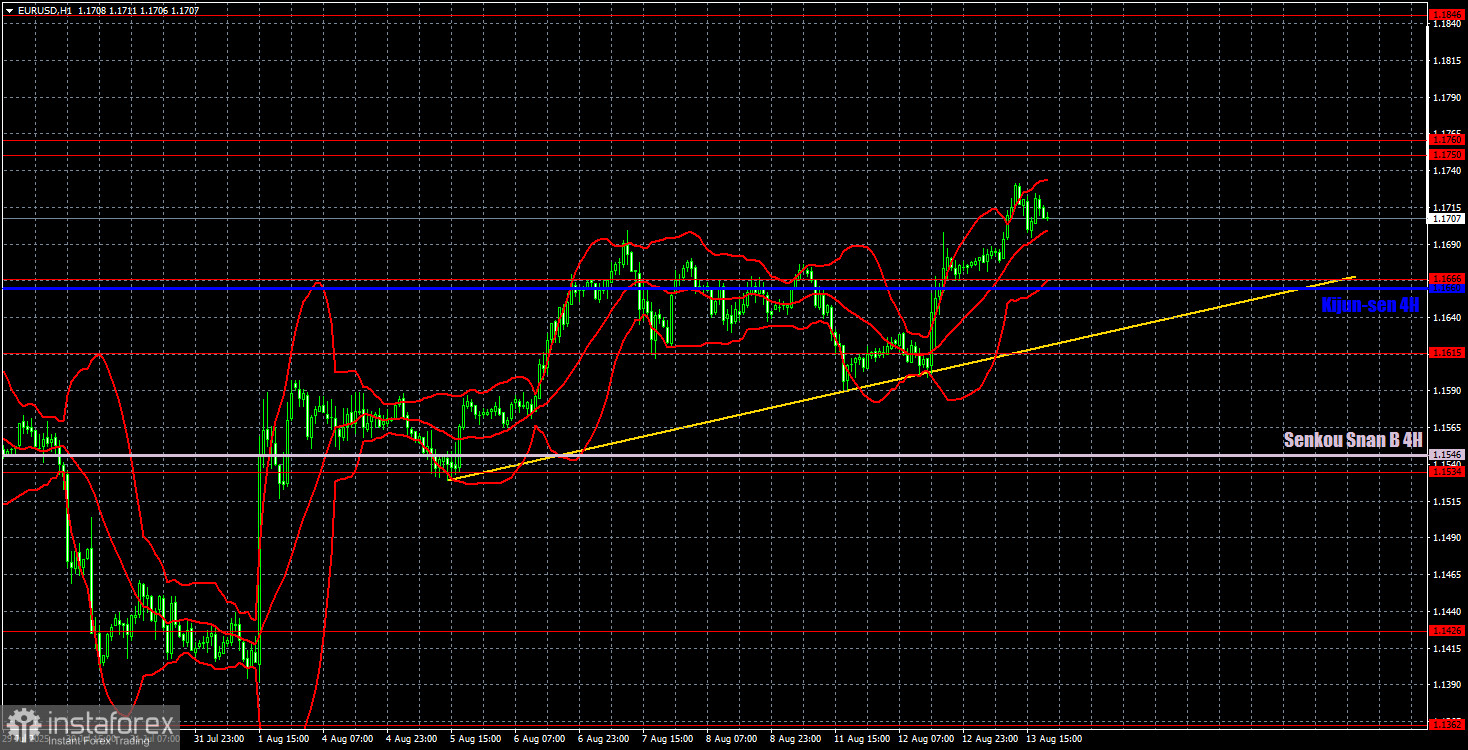
On the hourly chart, EUR/USD continues to develop a new upward trend. This new wave of growth began after the price bounced from the Senkou Span B line on the daily time frame. Thus, the dollar underwent a very technical correction while the bullish trend remained intact. We are now observing a new leg upward that is fully supported by the current fundamental background.
For August 14, we highlight the following trading levels: 1.1092, 1.1147, 1.1185, 1.1234, 1.1274, 1.1362, 1.1426, 1.1534, 1.1615, 1.1666, 1.1750–1.1760, 1.1846–1.1857, as well as the Senkou Span B line (1.1546) and the Kijun-sen line (1.1660). The Ichimoku indicator lines may shift during the day, which should be taken into account when identifying trading signals. Remember to move the Stop Loss to breakeven if the price moves 15 pips in the correct direction — this will protect against possible losses if the signal turns out to be false.
On Thursday, the euro area will release the second GDP estimate for Q2 and industrial production data. In the U.S., the producer price index and jobless claims will be published. Among these, only euro area industrial production can be considered significant, while the rest are of secondary importance.
On Thursday, the upward movement may well continue, supported by the bounce from the Senkou Span B line (daily time frame) and the broader fundamental background. Therefore, we remain focused on long positions with a target of 1.1750–1.1760, and if this area is broken, the next target will be 1.1846.


