یہ بھی دیکھیں

 15.08.2025 11:25 AM
Trend Analysis (Fig. 1)
On Friday, from the level of 1.1646 (yesterday's daily candle close), the market may begin moving upward toward 1.1697 – the 76.4% retracement level (yellow dotted line). Upon testing this level, a pullback down is possible toward 1.1680 – the 14.6% retracement level (blue dotted line).
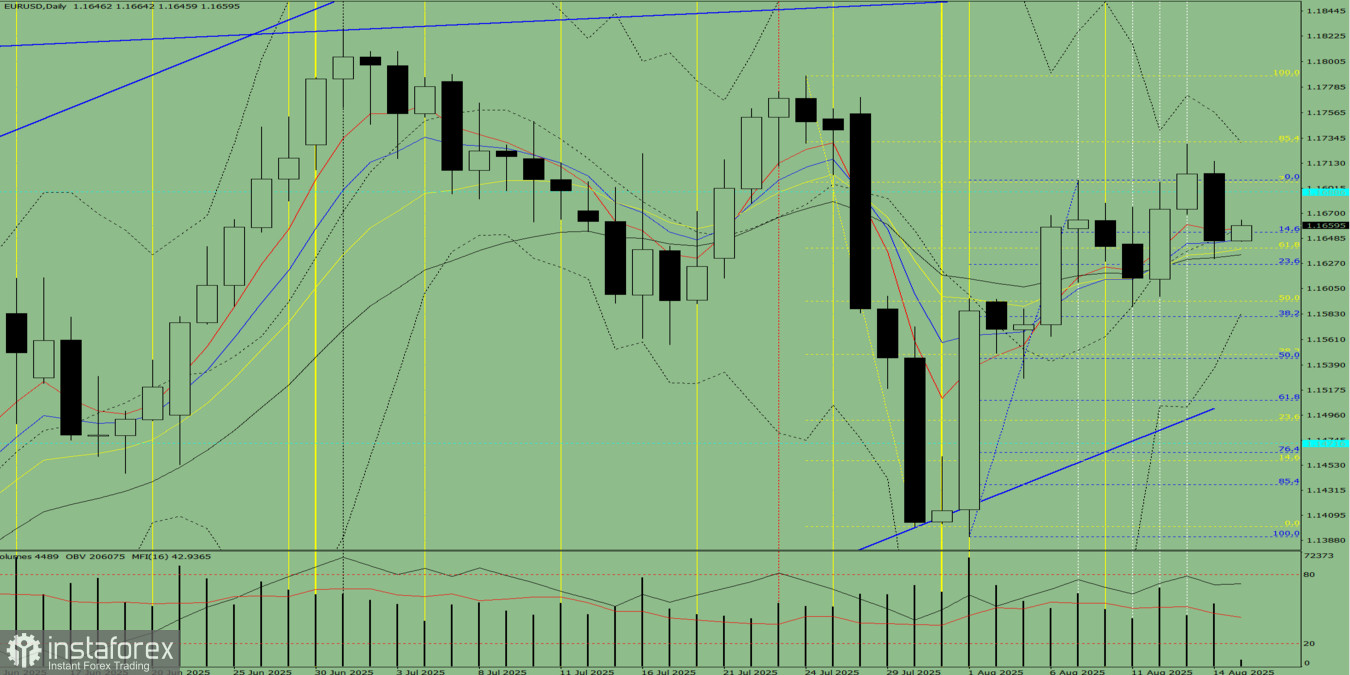
Fig. 1 (Daily Chart)
Comprehensive Analysis:
Overall conclusion: Uptrend.
Alternative scenario: Today, from the level of 1.1646 (yesterday's daily candle close), the price may start moving upward toward 1.1697 – the 76.4% retracement level (yellow dotted line). Upon testing this level, the upward move may continue toward 1.1730 – the upper fractal (blue dotted line).
You have already liked this post today
*تعینات کیا مراد ہے مارکیٹ کے تجزیات یہاں ارسال کیے جاتے ہیں جس کا مقصد آپ کی بیداری بڑھانا ہے، لیکن تجارت کرنے کے لئے ہدایات دینا نہیں.


