یہ بھی دیکھیں


 29.08.2025 04:48 AM
Bitcoin, the leading cryptocurrency, continues to leave risk despite the growth of US stock indexes. This is likely because European and Asian stock indexes are in no hurry to share such questionable optimism.
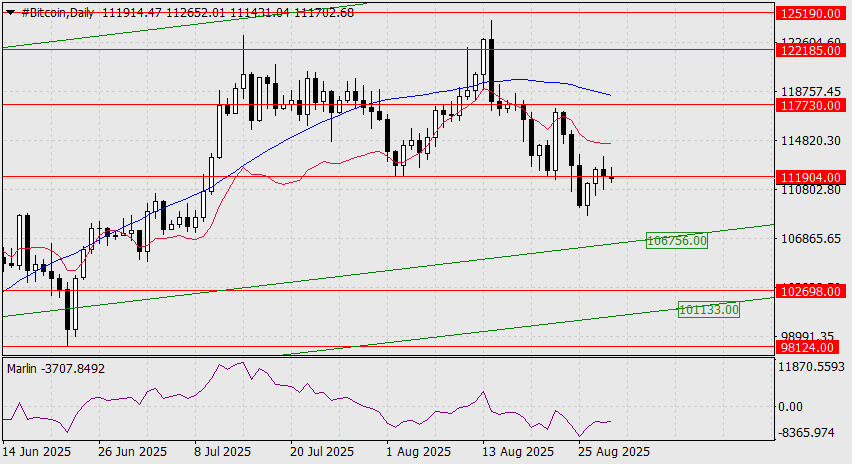
On the daily chart, Bitcoin made a false breakout above the 111,904 level yesterday, and today's candle has already opened below it. The Marlin oscillator has relieved selling pressure, but has now slightly increased and appears ready to resume its decline. The nearest target is 106,756 — the embedded line of the price channel.
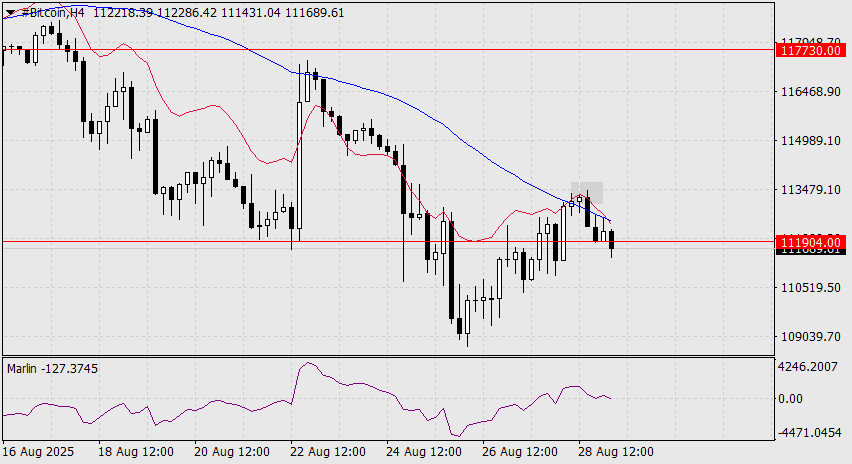
On the four-hour chart, the price also performed a false consolidation above the MACD line (gray rectangle) but is now firmly below it and is attacking the support level at 111,904. The signal line of the Marlin oscillator has entered negative territory. The trend is downward.
You have already liked this post today
*تعینات کیا مراد ہے مارکیٹ کے تجزیات یہاں ارسال کیے جاتے ہیں جس کا مقصد آپ کی بیداری بڑھانا ہے، لیکن تجارت کرنے کے لئے ہدایات دینا نہیں.


