یہ بھی دیکھیں

 04.09.2025 10:50 AM
Trend analysis (Fig. 1).
On Thursday, the market from the level of 1.1660 (yesterday's daily close) may start moving downward with the target at 1.1594 – the 50% retracement level (yellow dotted line). Upon testing this level, the price may bounce upward toward 1.1608 – the 38.2% retracement level (blue dotted line).
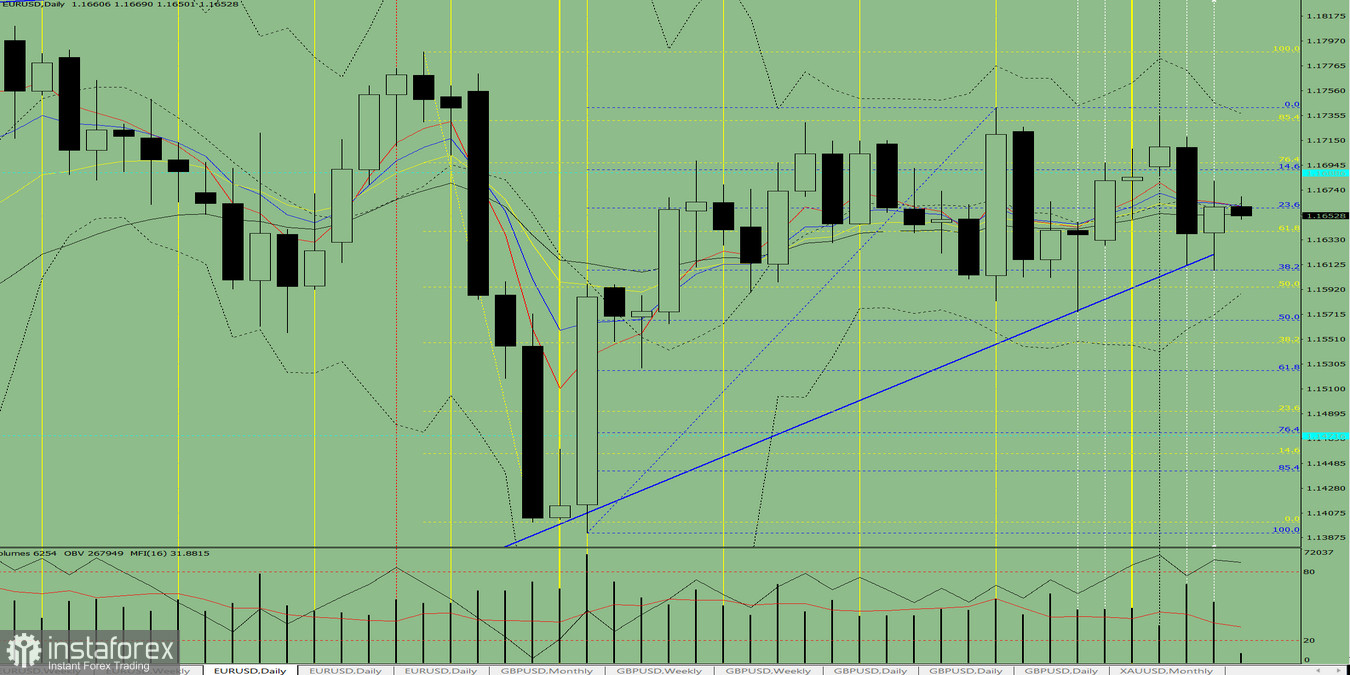
Fig. 1 (daily chart).
Comprehensive analysis:
Overall conclusion: downward trend.
Alternative scenario: On Thursday, the market from the level of 1.1660 (yesterday's daily close) may start moving downward with the target at 1.1566 – the 50% retracement level (blue dotted line). Upon testing this level, the price may bounce upward toward 1.1594 – the 50% retracement level (yellow dotted line).
You have already liked this post today
*تعینات کیا مراد ہے مارکیٹ کے تجزیات یہاں ارسال کیے جاتے ہیں جس کا مقصد آپ کی بیداری بڑھانا ہے، لیکن تجارت کرنے کے لئے ہدایات دینا نہیں.


