یہ بھی دیکھیں

 08.09.2025 10:01 AM
Trend analysis (Fig. 1).
On Monday, from the level of 1.1718 (Friday's daily candle close), the market may begin moving downward with a target of 1.1691 – the 14.6% pullback level (blue dotted line). Upon reaching this level, an upward move is possible with a target of 1.1697 – the 76.4% pullback level (yellow dotted line).
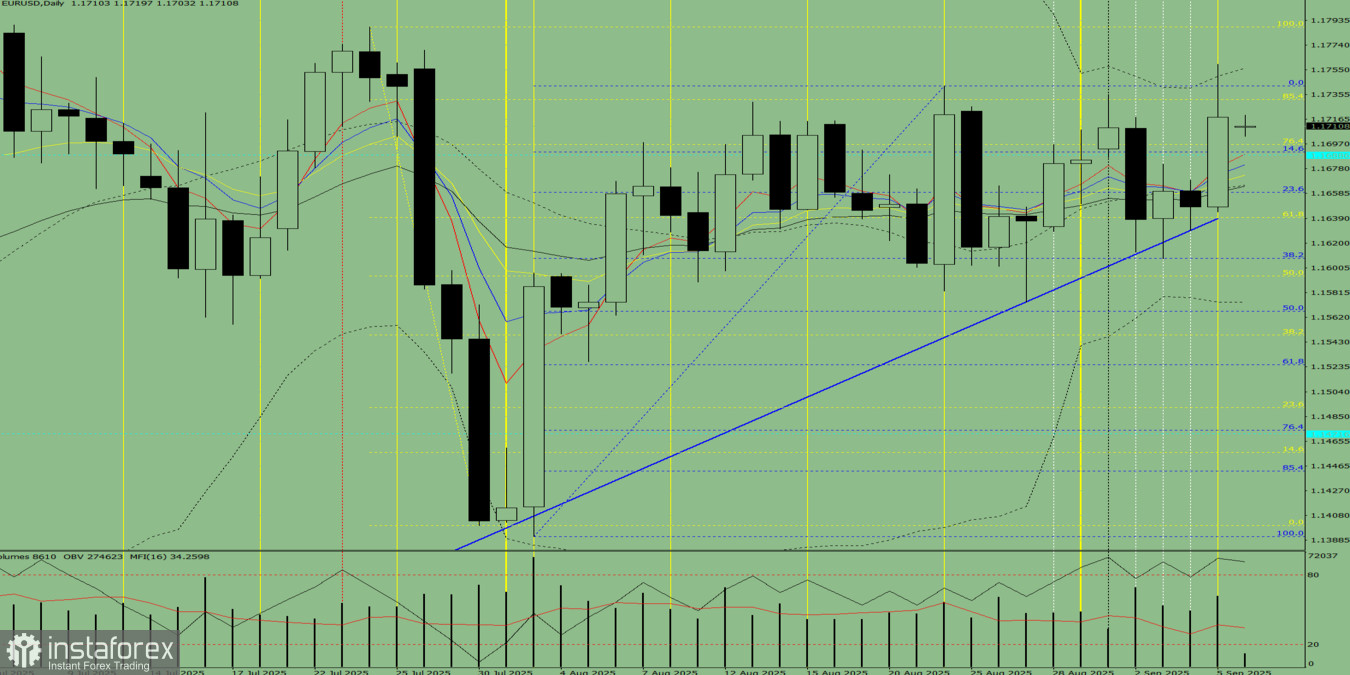
Fig. 1 (daily chart).
Comprehensive analysis:
Overall conclusion: Uptrend.
Alternative scenario: From the level of 1.1718 (Friday's daily candle close), the price may start moving downward with a target of 1.1659 – the 23.6% pullback level (blue dotted line). Upon reaching this level, a pullback upward is possible with a target of 1.1680 – the 14.6% pullback level (blue dotted line).
You have already liked this post today
*تعینات کیا مراد ہے مارکیٹ کے تجزیات یہاں ارسال کیے جاتے ہیں جس کا مقصد آپ کی بیداری بڑھانا ہے، لیکن تجارت کرنے کے لئے ہدایات دینا نہیں.


