یہ بھی دیکھیں

 08.09.2025 10:16 AM
Trend analysis (Fig. 1).
This week, from the level of 1.1718 (close of the last weekly candle), the market may start moving downward with a target of 1.1536 – the 38.2% retracement level (blue dotted line). Upon testing this level, the price may begin moving upward with a target of 1.1571 – the upper fractal (red dotted line).
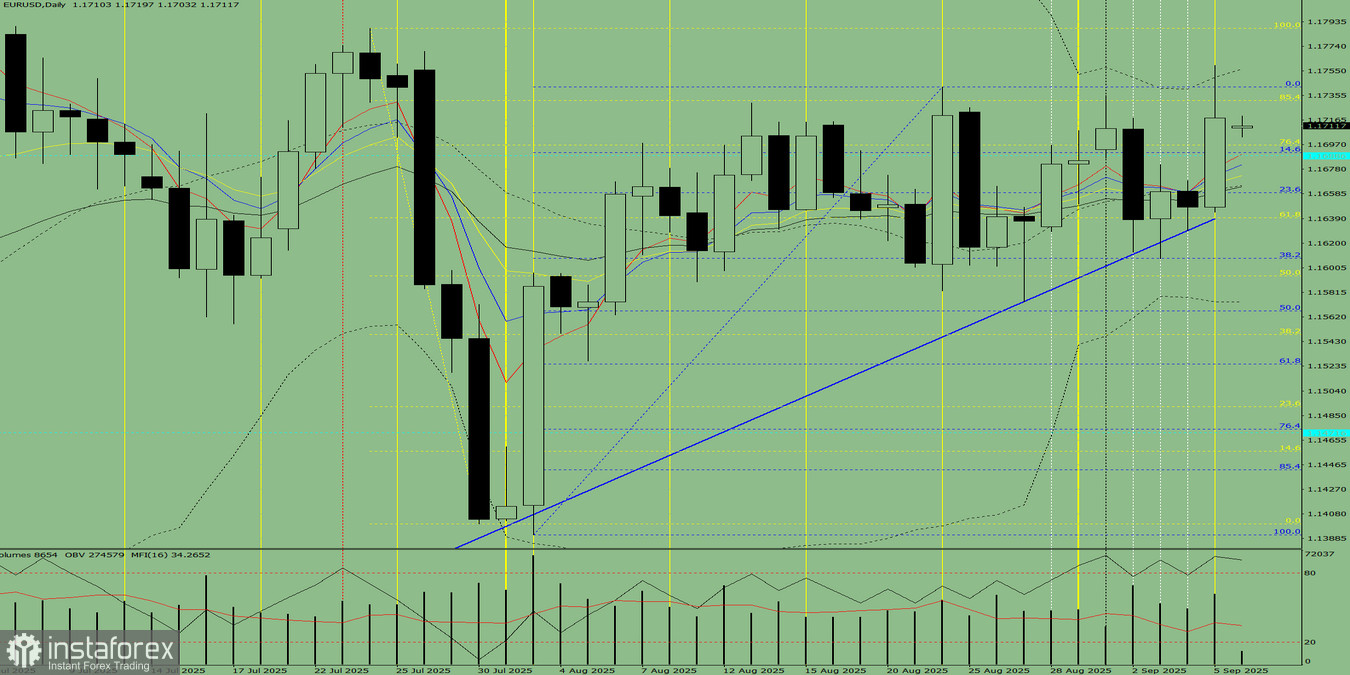
Fig. 1 (weekly chart).
Comprehensive analysis:
Conclusion from comprehensive analysis: Downward movement.
Overall summary of the EUR/USD weekly candle calculation: The price will most likely have a downward tendency during the week, with the absence of the first upper shadow on the weekly black candle (Monday – down) and the presence of the second lower shadow (Friday – up).
Alternative scenario: From the level of 1.1718 (close of the last weekly candle), the pair may begin moving downward with a target of 1.1498 – the 85.4% retracement level (red dotted line). Upon testing this level, the price may then move upward with a target of 1.1536 – the 38.2% retracement level (blue dotted line).
You have already liked this post today
*تعینات کیا مراد ہے مارکیٹ کے تجزیات یہاں ارسال کیے جاتے ہیں جس کا مقصد آپ کی بیداری بڑھانا ہے، لیکن تجارت کرنے کے لئے ہدایات دینا نہیں.


