یہ بھی دیکھیں

 22.09.2025 11:24 AM
Trend Analysis
This week, from the 1.3466 level (close to the last weekly candle), the price may continue to decline toward the target of 1.3270 – a historical support level (light blue dashed line). Upon testing this level, the price may rebound upward toward 1.3389 – the 23.6% retracement level (red dashed line).
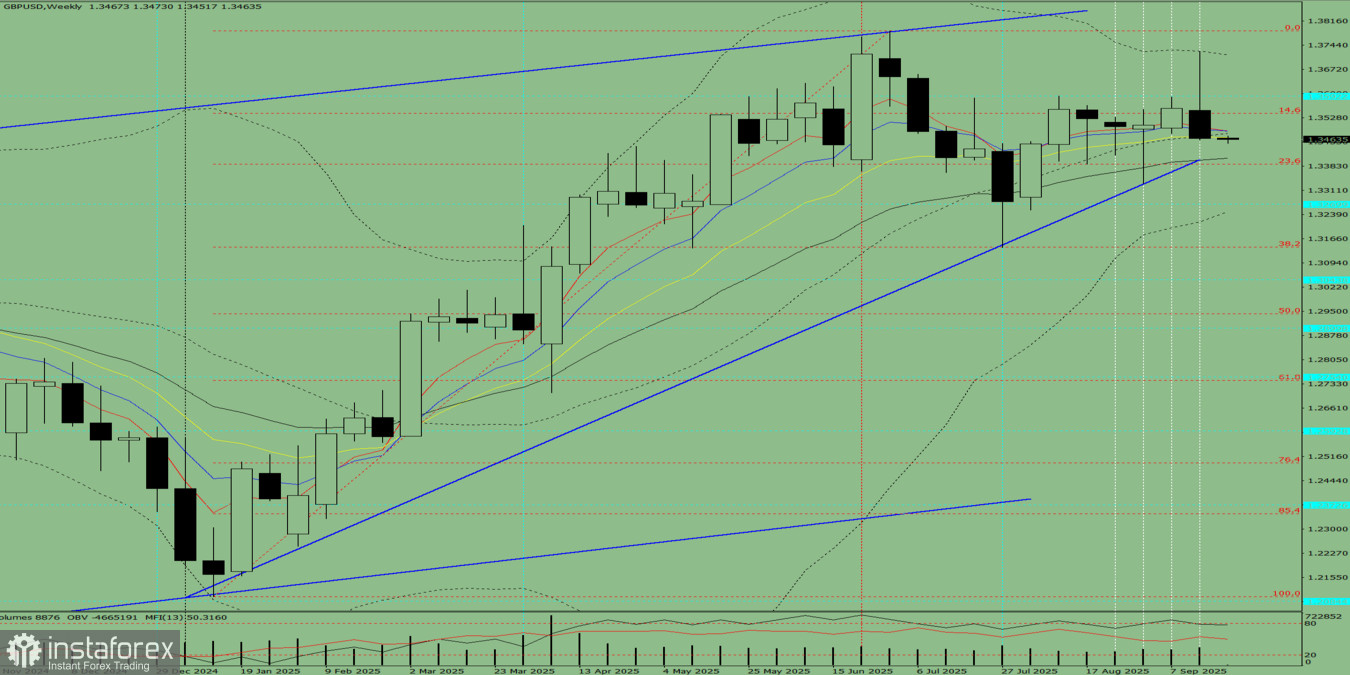
Fig. 1 (weekly chart)
Comprehensive Analysis:
Overall forecast for the GBP/USD weekly candle: the price will most likely follow a downward trend throughout the week, with no upper shadow on the weekly black (bearish) candle (Monday – downside movement), and a lower shadow present (Friday – upward rebound).
Alternative Scenario: From the 1.3466 level (close of the last weekly candle), the price may start by continuing its downward movement toward 1.3389 – the 23.6% retracement level (red dashed line). Upon reaching this level, a price increase toward 1.3470 – the 13-period EMA (yellow thin line) is possible.
You have already liked this post today
*تعینات کیا مراد ہے مارکیٹ کے تجزیات یہاں ارسال کیے جاتے ہیں جس کا مقصد آپ کی بیداری بڑھانا ہے، لیکن تجارت کرنے کے لئے ہدایات دینا نہیں.


