Veja também


 21.12.2023 01:12 PM
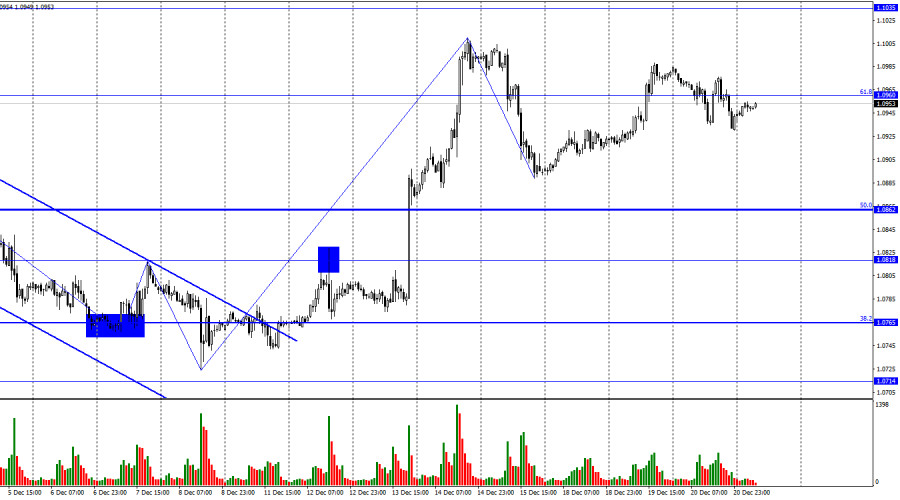
The EUR/USD pair reversed in favor of the U.S. dollar on Wednesday, consolidating below the corrective level of 61.8% (1.0960). Thus, the downward process may continue toward the next Fibonacci level of 50.0% (1.0862). I support the scenario of further decline in the pair, as, judging by the waves, the trend seems to be shifting towards the "bearish" side. However, a firm hold above the level of 1.0960 will indicate that bulls are not ready to retreat fully and may attempt to resume growth towards the level of 1.1035.
The wave situation is becoming clearer and more favorable. The last downward wave turned out to be relatively weak (compared to the previous upward wave), and the current upward wave has every chance of not surpassing the peak of the previous wave (from December 14). If this scenario unfolds, we will have the first sign of completing the "bullish" trend. In this case, a decline towards the level of 1.0862 should begin, which may only be the start of a prolonged "bearish" trend. This is the scenario I am currently counting on.
On Wednesday, there were a few interesting events in the European Union and the United States. The only U.S. report on the number of new home sales showed a value slightly higher than traders expected for November. However, this report is unimportant, and traders' reactions were practically nonexistent. Thus, this week, I can highlight only two events. The first one is the inflation report in the European Union, which showed a final decrease in November to 2.4% y/y, and the U.S. GDP report for the third quarter, which will be released today in the second half of the day.
As with European inflation, the report on economic growth in the U.S. may not cause a strong reaction. This is not the first estimate of the indicator for the third quarter, and traders are prepared to see +5.2% q/q. If today's report shows a higher or lower value, then bulls or bears will receive minor support. But overall, this week's information background is quite weak, with important reports coming only from the United Kingdom. By the end of the week, trader activity may be relatively low, but I still expect a decline in the pair toward the level of 1.0862. This target already looks quite attractive.
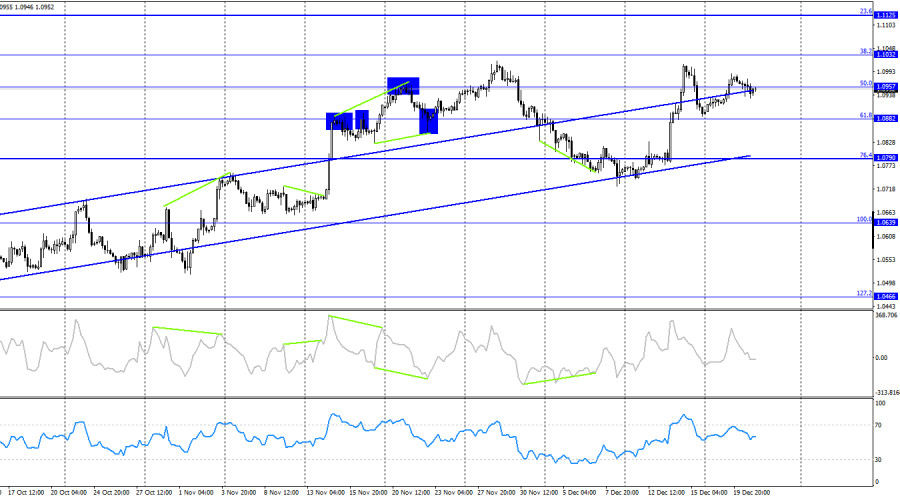
On the 4-hour chart, the pair rose to the corrective level of 50.0% (1.0957). A firm consolidation of the pair's rate above this level allows counting on further growth towards the next Fibonacci level of 38.2% at 1.1032. Reconsolidation below 1.0957 will again favor the U.S. currency and a fall to the lower line of the ascending trend corridor, which still characterizes traders' sentiment as "bullish." I expect a significant decline in the euro only after consolidating below the ascending trend corridor. Still, even under the current circumstances, a decline towards the lower line of the corridor looks promising. There are no apparent divergences with any indicator today.
Forecast for EUR/USD and trader advice:
What advice can be given to traders today? The rise of the European currency is unlikely. The continuation of the "bullish" trend is also unlikely. The information background could be stronger; the economic events calendar for the EU and the U.S. is practically empty, and traders will find it difficult to find new reasons for buying. Thus, a resumption of the decline towards the level of 1.0862 is likely. A consolidation below the level of 1.0960 can be considered for selling the pair. I consider purchases today impractical and too risky."
You have already liked this post today
*A análise de mercado aqui postada destina-se a aumentar o seu conhecimento, mas não dar instruções para fazer uma negociação.
[XAU/USD] – [Quarta-feira, 13 de agosto de 2025] O XAU/USD parece estar tentando testar seu nível de suporte mais próximo, conforme confirmado pelo indicador RSI (14), que se encontra
[AUD/USD] – [Quarta-feira, 13 de agosto de 2025] Com a posição AUD/USD, que tem a EMA (50) ainda acima do nível da EMA (200) e o RSI (140) na zona
Se o ouro testar o nível de 3.340 nas próximas horas e conseguir se manter acima dessa área, isso será visto como uma oportunidade de compra, com alvos em 3.360
[USD/CAD] – [terça-feira, 12 de agosto de 2025] Apesar do surgimento de divergência entre o RSI(14) e os movimentos de preço do dólar canadense, a cruz dourada entre a EMA(50)
[GBP/USD] – [Terça-feira, 12 de agosto de 2025] Há potencial para uma correção de baixa no Cabo hoje, mas, desde que não rompa e feche abaixo de 1,3357, a tendência
Se o Ether se consolidar abaixo de 4.205 nos gráficos 4H, poderá atingir o nível 5/8 de Murray em 4.062 e, eventualmente, alcançar o nível 4/8 de Murray em 3.750
O euro está sendo negociado próximo de 1,1618, acima da EMA de 200 períodos e acima do nível 6/8 de Murray, recuperando parte das perdas do dia anterior, mas apresentando
Ferrari F8 TRIBUTO
da InstaForex
InstaForex em números

Your IP address shows that you are currently located in the USA. If you are a resident of the United States, you are prohibited from using the services of InstaFintech Group including online trading, online transfers, deposit/withdrawal of funds, etc.
If you think you are seeing this message by mistake and your location is not the US, kindly proceed to the website. Otherwise, you must leave the website in order to comply with government restrictions.
Why does your IP address show your location as the USA?
Please confirm whether you are a US resident or not by clicking the relevant button below. If you choose the wrong option, being a US resident, you will not be able to open an account with InstaTrade anyway.
We are sorry for any inconvenience caused by this message.


