Veja também

 09.05.2025 04:05 AM
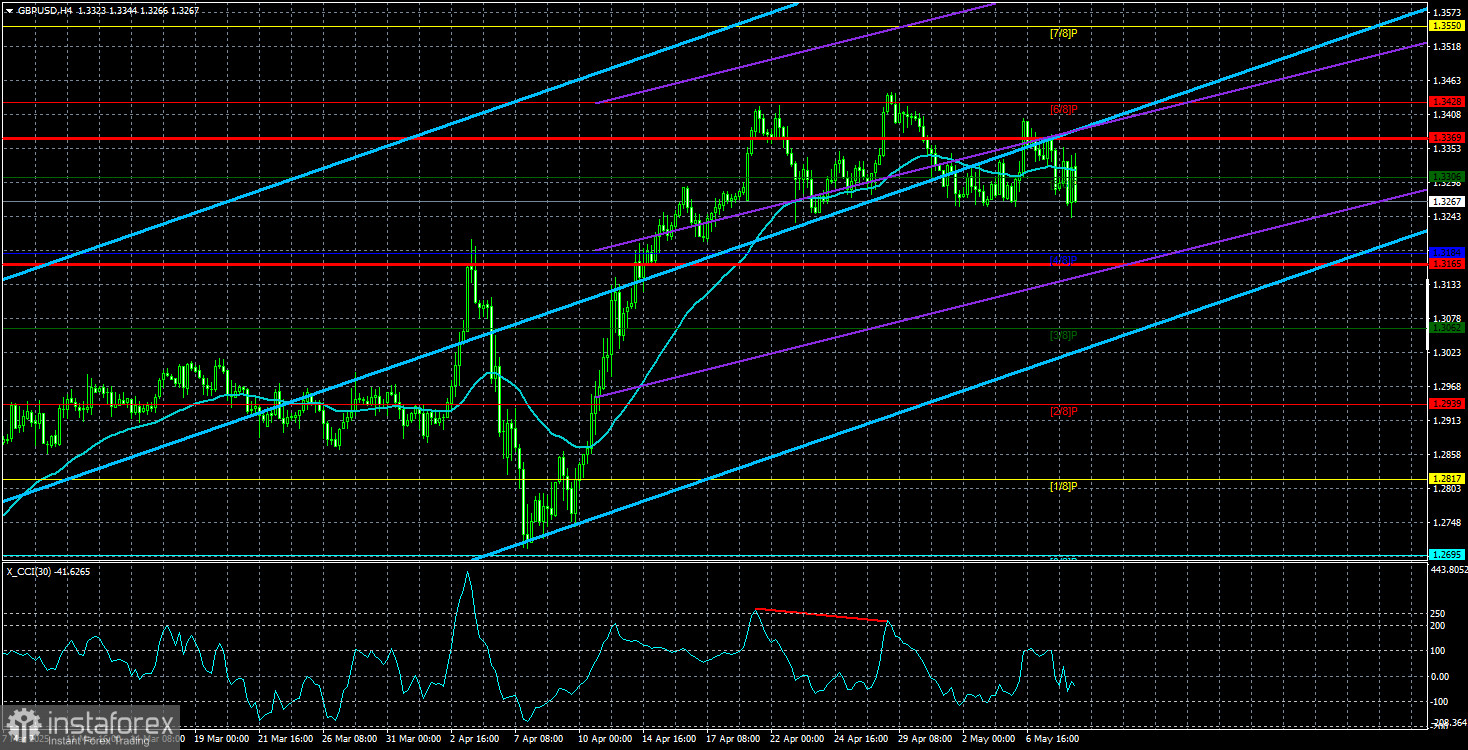
The GBP/USD currency pair moved downwards first and then upwards on Thursday, indicating that the market has not yet decided how to interpret the Bank of England's meeting results. The British central bank cut the key interest rate by 0.25%, the second time this year. This decision was expected, and as we've said before, if the market had wanted to sell off the pound in response to the Bank's dovish move, it would have started doing so back on Monday or Tuesday. Since there had been no drop in the pound during the week, it was easy to assume there wouldn't be one on Thursday either.
However, things were not as simple as they seemed. It turned out that seven out of nine members of the Monetary Policy Committee voted for a rate cut, with two of them supporting a deeper cut of 0.5%. Two other members voted to keep the rate unchanged. These results sharply contrast with forecasts that predicted all nine members would vote for easing policy. But it's difficult to say whether the vote outcome was more dovish or hawkish.
The market interpreted it as hawkish, although that interpretation is highly debatable. As we've already mentioned, the market seems unwilling to buy the dollar under any circumstances and appears uninterested in trading until Trump clarifies his next steps in the trade war. The number one priority for traders remains the trade war and its potential consequences, which could be far more damaging to the U.S. economy than to the British or European economies. It's simple: Europe and Britain are dealing with one opponent — the U.S., while America is up against half the world due to the tariffs imposed by Trump.
Therefore, regardless of the BoE's decision, we did not expect a rally in the U.S. dollar. And it didn't happen. Both EUR/USD and GBP/USD are trading in clear sideways channels. Whatever news traders receive in the near future, as long as it doesn't concern the trade war, the dollar stands very little chance of appreciating because the market is focused solely on the trade war.
The BoE also updated its forecasts for economic indicators. Growth for 2025 is now expected at 1% (up from 0.75%), and inflation is projected to return to 2% by 2027, earlier than previously forecast. It's hard to say what exactly caused this wave of optimism from the British central bank, but the fact remains. It's likely that the pound received support due to these optimistic forecasts.
One way or another, the GBP/USD pair still can't even manage a slight downward correction. If news arises soon regarding failures in U.S.-EU or U.S.-China trade talks, the dollar might continue its decline. If Trump returns to his policy of "taxing the entire world," the dollar may also resume falling.
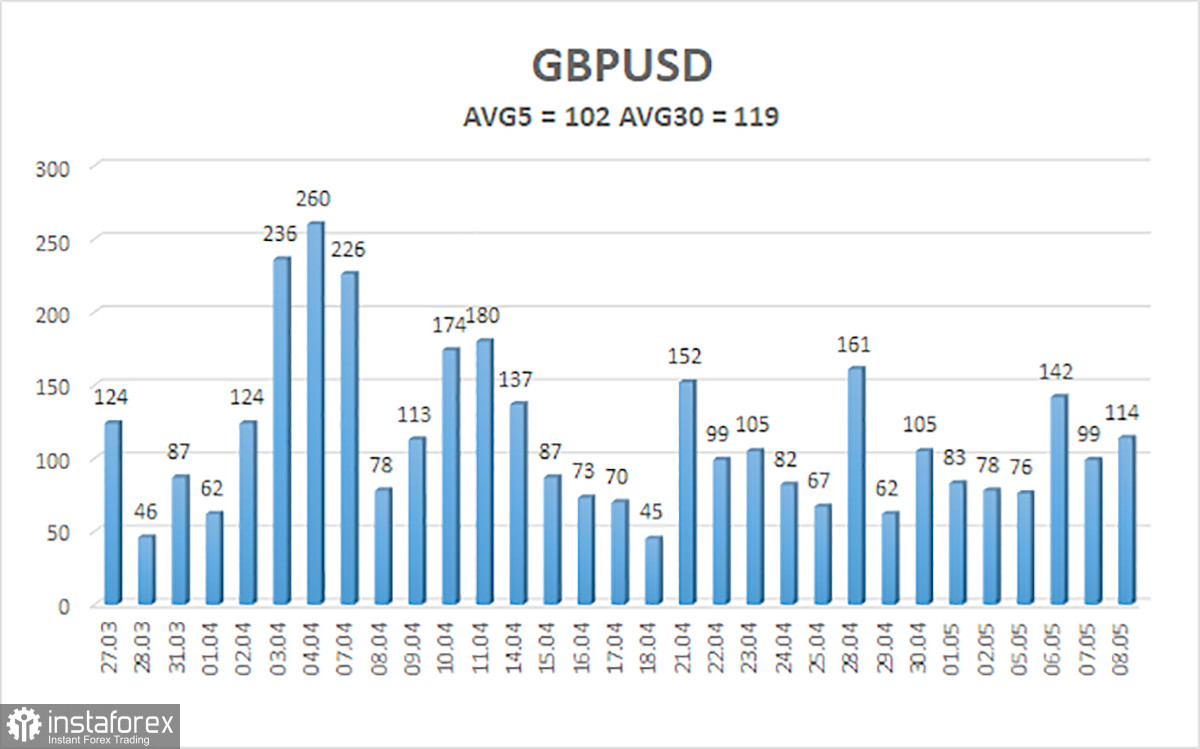
The average volatility of GBP/USD over the last five trading days is 102 pips, which is considered "average" for this pair. On Friday, May 9, we expect movement within the range of 1.3165 to 1.3369. The long-term regression channel is pointing upward, indicating a clear uptrend. The CCI indicator formed a bearish divergence, which triggered the current drop, although that move has already ended.
The GBP/USD pair remains in an upward trend and quickly completed another weak correction. We still believe there are no fundamental reasons for the pound to rise. The pound isn't rising — the dollar is falling, and it's been doing so for two to three months. And it's falling solely because of Donald Trump. Therefore, Trump's actions could just as easily provoke a strong downward move or another surge. If you are trading on "pure technicals" or "on Trump," long positions remain relevant with a target of 1.3428 if the price is above the moving average. Sell orders are still appealing. Initial targets are 1.3184 and 1.3165 if the price is below the moving average. In recent weeks, the pair has been in a flat trend.
Linear Regression Channels help determine the current trend. If both channels are aligned, it indicates a strong trend.
Moving Average Line (settings: 20,0, smoothed) defines the short-term trend and guides the trading direction.
Murray Levels act as target levels for movements and corrections.
Volatility Levels (red lines) represent the likely price range for the pair over the next 24 hours based on current volatility readings.
CCI Indicator: If it enters the oversold region (below -250) or overbought region (above +250), it signals an impending trend reversal in the opposite direction.


