Veja também

 14.05.2025 03:52 AM
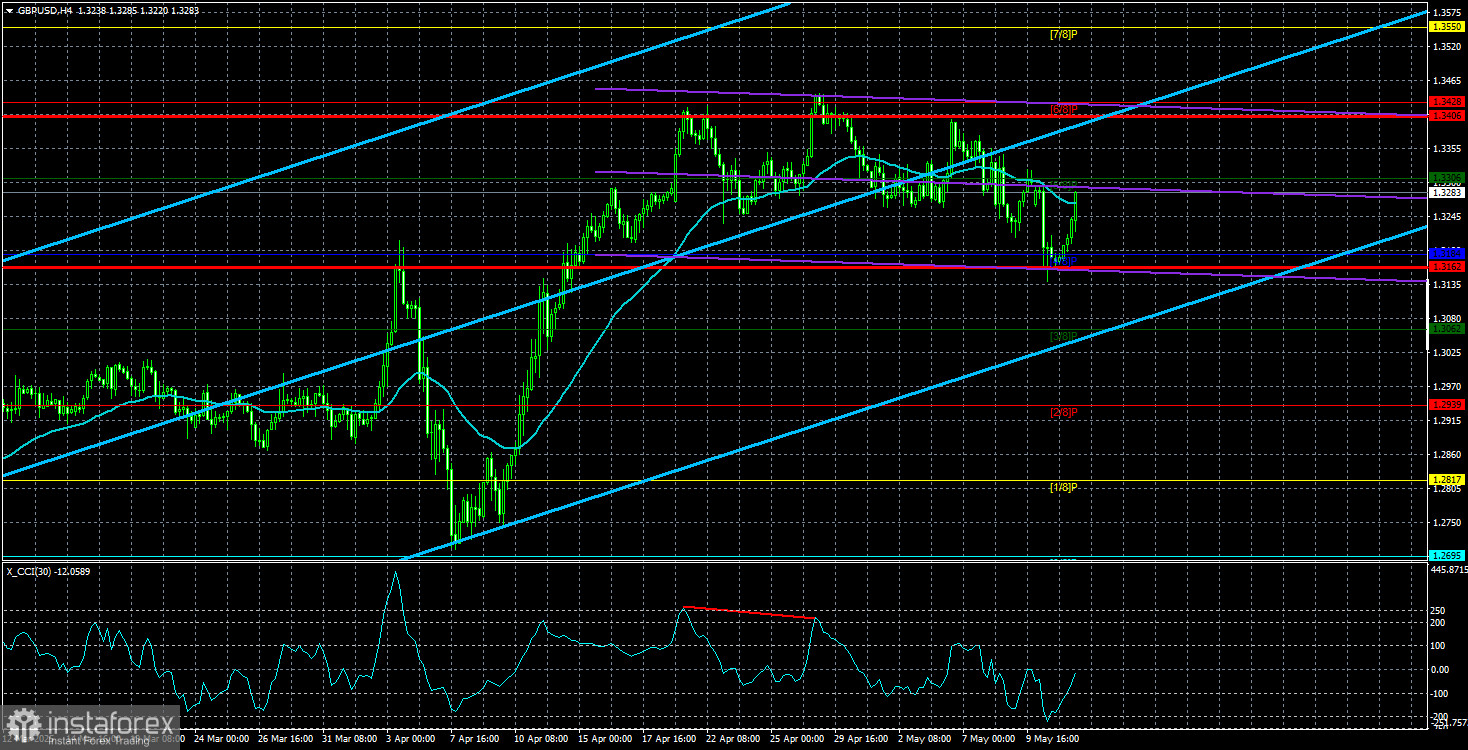
On Tuesday, the GBP/USD currency pair also ended what could only be called disgrace — its decline. On Monday, the U.S. dollar strengthened quite well following a successful first round of talks between the U.S. and China, although, in essence, both sides merely agreed not to shut down trade between the two nations completely. Thus, we're not talking about a formal deal, but rather the resumption of the trade process. Had this agreement not been reached, both economies would have continued to lose tens or even hundreds of billions of dollars, which no one wants.
We were once again reminded that, for traders at this moment, only developments in trade are significant. Last week, the Bank of England cut the key interest rate, the Federal Reserve maintained a "hawkish" stance, and the latest U.S. labor market and unemployment data were more encouraging than disappointing. Yet none of these events or releases triggered a significant dollar strengthening or helped the GBP/USD pair exit its sideways channel. As soon as Washington and Beijing agreed to lower tariffs for each other, the flat phase ended, and the dollar gained 130 pips in just a few hours.
Our perspective remains the same: currently, only trade-related developments hold significance. Important reports may cause short-term reactions, but don't influence the overall price direction.
At the same time, the British pound clearly cannot demonstrate growth that would be considered fundamentally justified. In other words, all the recent strength in the pound has little to do with the actual state of the UK economy. On the contrary, many UK macroeconomic indicators are deteriorating or remain weak. Just yesterday, it was reported that the unemployment rate rose to 4.5%. While that's not catastrophic, it was unexpected by the market, and any rise in unemployment is inherently bad for an economy. So, how did the market react? Precisely — it didn't. This once again proves how irrelevant macroeconomic data is at the moment.
We believe the dollar could strengthen by another few hundred pips based solely on the agreement between the U.S. and China. After all, this isn't a deal with the UK (which the market effectively ignored). However, Tuesday showed us that the market still hesitates to buy the U.S. dollar, likely due to continued fears of new policy surprises from Donald Trump. Regardless of fundamentals and macroeconomics, Trump may now be a significant barrier to dollar growth.
We've said it before: the problem with the dollar and the U.S. economy lies not just in Trump's sanctions and tariffs, but in the fact that Trump has shown the world his way of doing business. Consumers in many countries are now consciously rejecting American goods, starting with Tesla. So even if tariffs are lifted and agreements are signed, no one can force consumers to buy American if they don't want to.
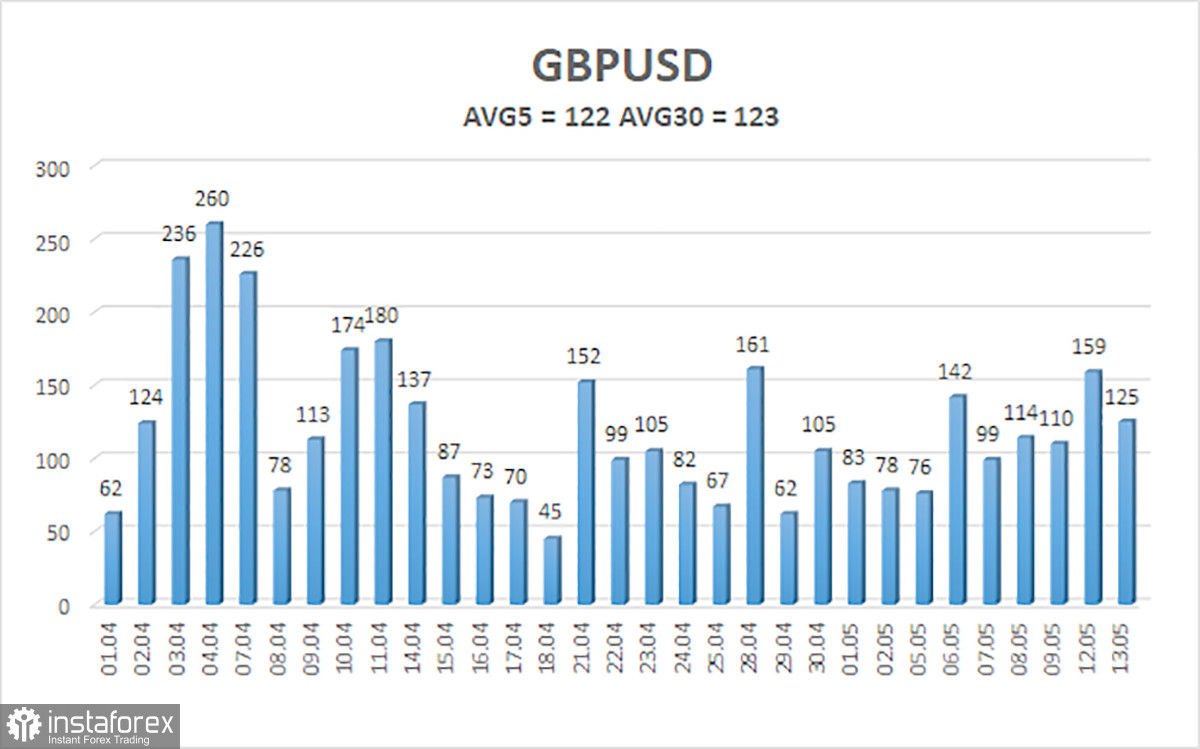
The average volatility of GBP/USD over the past five trading days is 122 pips, which is considered "high" for the pair. On Wednesday, May 14, we expect the pair to trade between 1.3162 and 1.3406. The long-term regression channel is pointing upward, indicating a clear uptrend. The CCI indicator has formed a bearish divergence, which triggered the latest decline.
S1 – 1.3184
S2 – 1.3062
S3 – 1.2939
R1 – 1.3306
R2 – 1.3428
R3 – 1.3550
The GBP/USD pair maintains its upward trend and resumed a correction thanks to the agreement between China and the U.S. We still believe there is no fundamental basis for pound strength. If the de-escalation of the trade conflict continues — and all signs point in that direction — the dollar could quickly return to the 1.2300–1.2400 area, where its previous decline "under Trump" began. Therefore, long positions do not seem relevant in the context of trade war de-escalation. If the price stays below the moving average, sell orders remain attractive, with initial targets at 1.3184 and 1.3162.
Linear Regression Channels help determine the current trend. If both channels are aligned, it indicates a strong trend.
Moving Average Line (settings: 20,0, smoothed) defines the short-term trend and guides the trading direction.
Murray Levels act as target levels for movements and corrections.
Volatility Levels (red lines) represent the likely price range for the pair over the next 24 hours based on current volatility readings.
CCI Indicator: If it enters the oversold region (below -250) or overbought region (above +250), it signals an impending trend reversal in the opposite direction.


