Veja também

 22.05.2025 08:09 AM
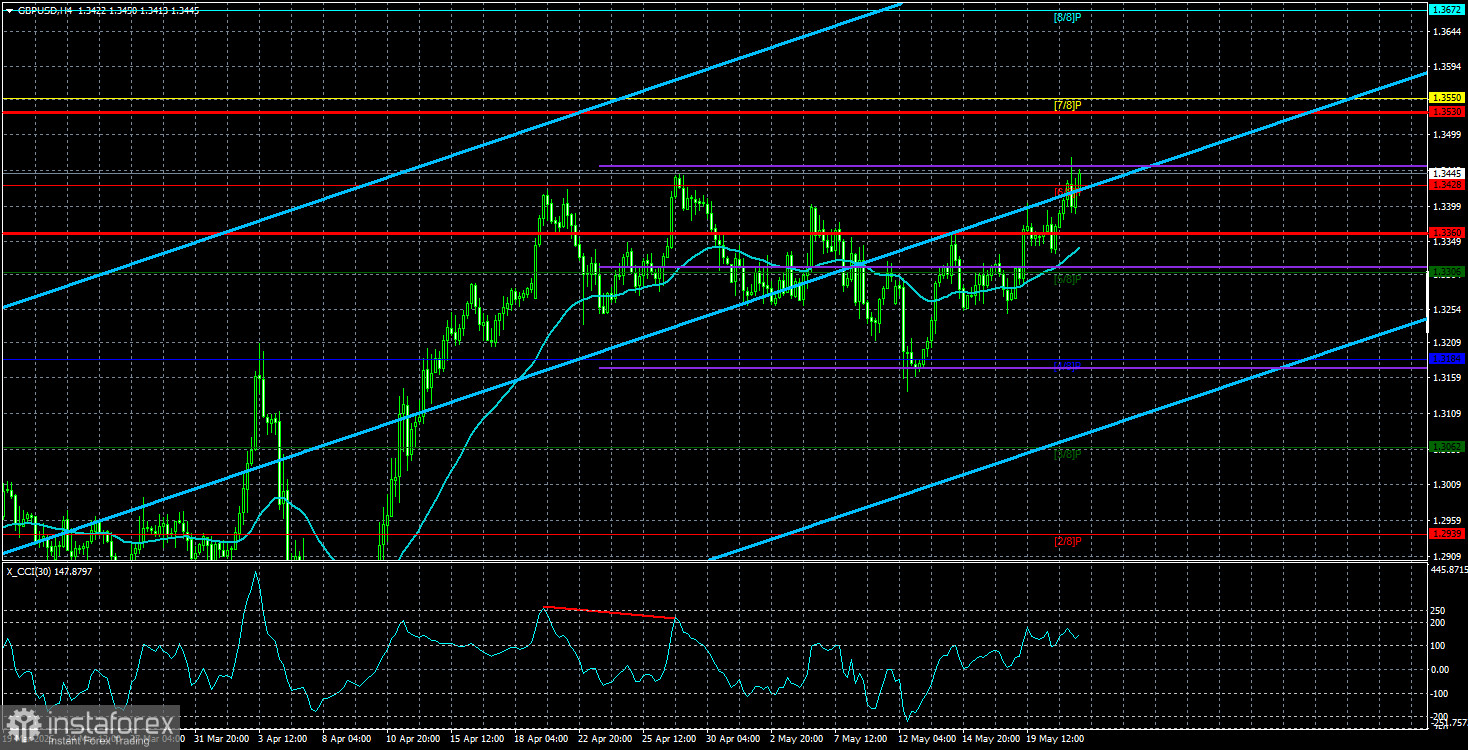
The GBP/USD currency pair continued to move north on Wednesday, even though, at first glance, there appeared to be no apparent reason for it. Yes, the inflation report—the only release of the day—in the UK showed a nearly 1% year-over-year jump, which is undoubtedly a positive factor for the British currency as it significantly reduces the likelihood of another round of monetary easing by the Bank of England in 2025. However, the pound sterling has been doing just fine without this report. It hasn't even seen the need to correct after a two-month rally. Even if the report hadn't been published, do you think the U.S. dollar could have gained ground?
It's also worth noting that nearly all of the pair's growth occurred overnight, before the inflation report was released. There were no macroeconomic reports in the U.S. or the UK on Monday and Tuesday. Once again, we see that the market is using any excuse to sell the U.S. dollar. And if there are no excuses, that's not a problem.
The trade deals that Trump keeps talking about still haven't been signed. Sure, many countries would prefer to negotiate peacefully with America, but few have reached that stage apart from the UK. The U.S. Congressional Budget Office estimates that Trump's new "One Big Beautiful Bill Act" will increase the budget deficit by $3.8 trillion between 2026 and 2034. Ratings agencies are downgrading the U.S. credit rating. These are just some of the latest developments which, although not directly tied to the dollar exchange rate, are being carefully watched by market participants. And the market's response remains clear—it's wiser to avoid the dollar. At least not while Trump is president.
A few days ago, we suggested that a de-escalation of the global trade war could trigger a sharp rise in the dollar. We still believe Washington will manage to strike deals with Brussels, Beijing, and other countries on its "blacklist." However, practice shows that even reducing global trade tensions is no longer a strong enough reason to support the dollar. The market understands that even if all 75 trade deals are signed, the conflict won't end. It just means the U.S. will continue to impose tariffs on various goods and services, but now "by agreement" and in a coordinated manner. In any case, import volumes into the U.S. will decline because prices will rise. As we've said before, the American people will end up paying for all of Trump's "bright future" initiatives. And the market will continue to dump the U.S. dollar—"because of Donald Trump". At this point, no other explanation is needed to justify another drop in the dollar.
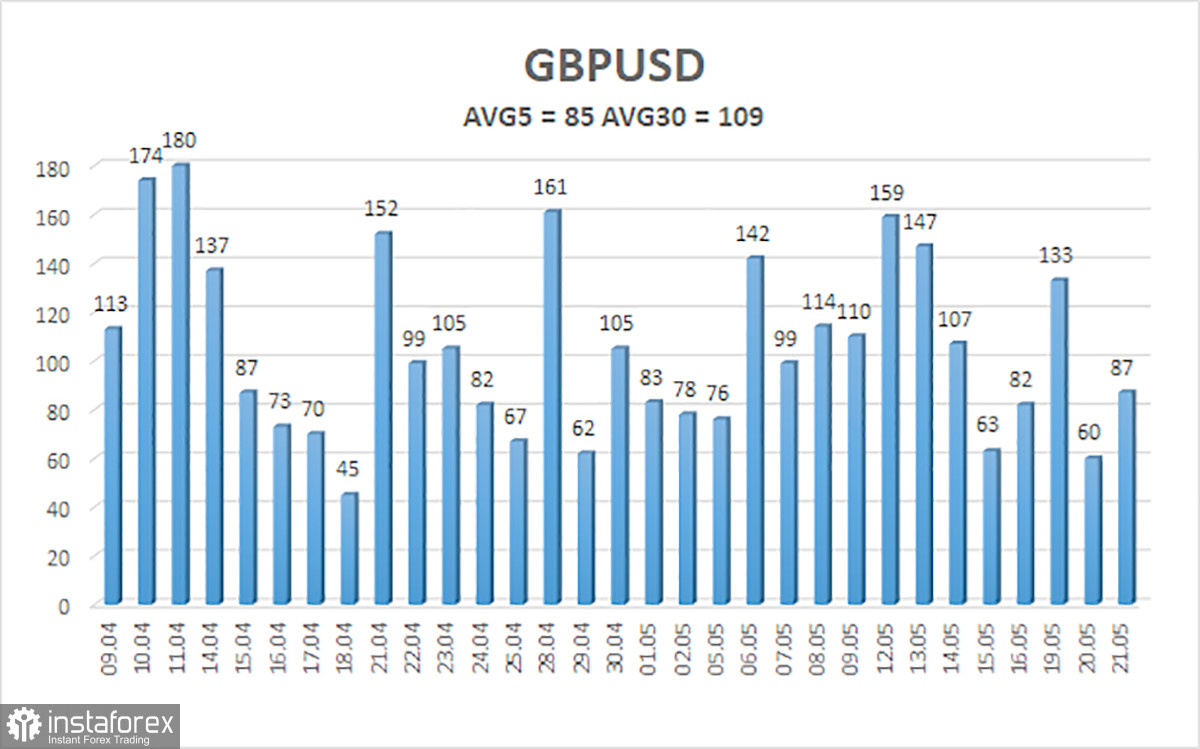
The average volatility of the GBP/USD pair over the past five trading days stands at 85 pips, which is considered "moderate." On Thursday, May 22, we expect movement within the range of 1.3360 to 1.3530. The long-term regression channel is pointing upward, confirming a clear bullish trend. The CCI indicator hasn't entered extreme zones recently.
S1 – 1.3306
S2 – 1.3184
S3 – 1.3062
R1 – 1.3428
R2 – 1.3550
R3 – 1.3672
The GBP/USD pair maintains its upward trend and has resumed its rally thanks to various factors (Federal Reserve and Bank of England policy, trade war de-escalation). If the trade conflict continues to ease—and that seems to be the case—the dollar could strengthen. However, the market appears to have developed a personal aversion to it. We believe that long positions cannot be considered highly relevant under current conditions, but the market is also outright rejecting short positions, which keeps long setups on the table with targets at 1.3530 and 1.3550. A move below the moving average would allow for short positions with a target at 1.3184.
Linear Regression Channels help determine the current trend. If both channels are aligned, it indicates a strong trend.
Moving Average Line (settings: 20,0, smoothed) defines the short-term trend and guides the trading direction.
Murray Levels act as target levels for movements and corrections.
Volatility Levels (red lines) represent the likely price range for the pair over the next 24 hours based on current volatility readings.
CCI Indicator: If it enters the oversold region (below -250) or overbought region (above +250), it signals an impending trend reversal in the opposite direction.


