Veja também

 09.06.2025 05:54 AM
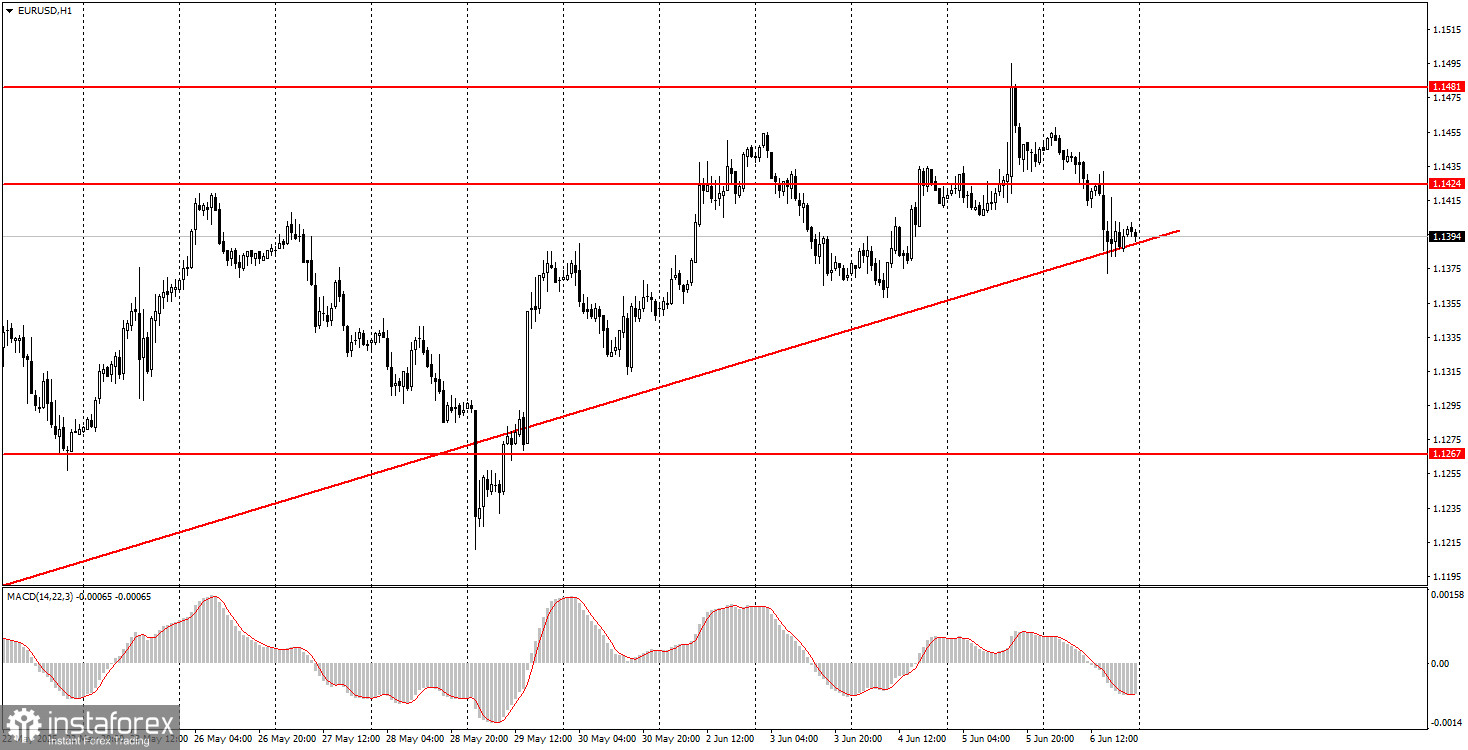
The EUR/USD currency pair traded lower on Friday, and there were objective reasons for this. However, it's important to note that by the end of the day, the dollar had strengthened by a "whole" 50 pips. It's hardly worth saying that 50 pips is insignificant, especially considering this growth occurred on rather decent and important data from across the ocean. The Nonfarm Payrolls report showed 139,000 new non-farm jobs created versus the forecast of 130,000. The unemployment rate remained unchanged at 4.2%. Let's just say that much weaker numbers from the U.S. data could have easily been expected. However, the American data, if not upbeat, were not disappointing either. The labor market remains stable, and the unemployment rate is not increasing. Of course, the figures will likely decline over time as Donald Trump's trade policies have yet to produce positive results for the U.S. economy—indeed, no results at all. Therefore, the dollar's position and prospects remain very uncertain.
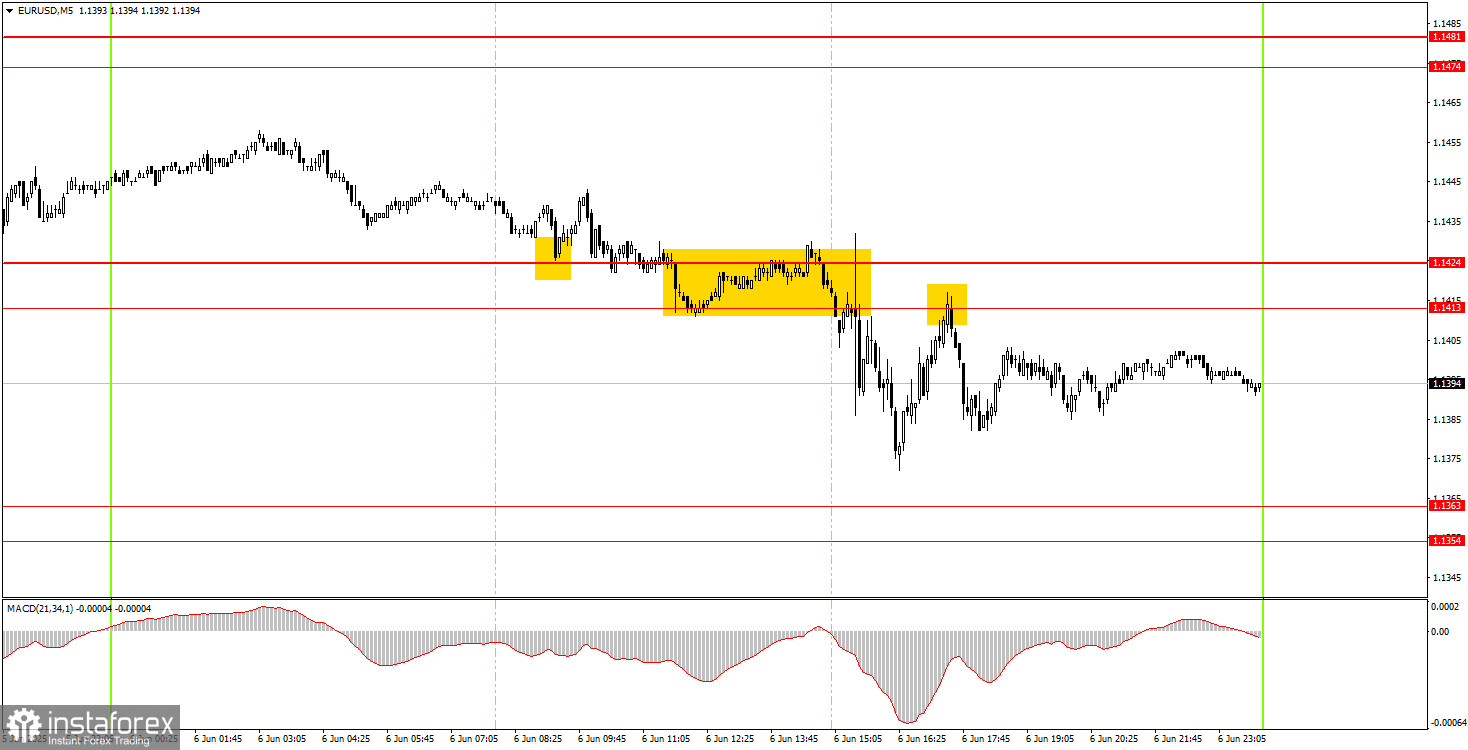
In the 5-minute timeframe on Friday, several choppy trading signals were generated. The first buy signal from a rebound off the 1.1413–1.1424 area was false. Then, a sell signal was formed in the same area, but it occurred during the release of U.S. data, so the risk of a loss on that signal was high. The third sell signal could have been traded but didn't yield significant profit. The dollar appreciated only slightly during the day, and the American reports did not provoke a strong rally in the dollar.
In the hourly timeframe, the EUR/USD pair broke the ascending trendline; however, the uptrend that started under Donald Trump remains intact. Essentially, the fact that Trump is the U.S. president is reason enough for the market to keep fleeing the dollar. If Trump continues to threaten, issue ultimatums, and impose/raise tariffs, the market will have few alternatives. Trump's tariffs couldn't be overturned, and negotiations with China and the EU are stalling again, so the trade war situation has not improved.
On Monday, the EUR/USD pair may move in either direction. Very limited macroeconomic data will be available, so it's best to rely on technical levels while preparing for a stagnant market.
On the 5-minute timeframe, the levels to watch are: 1.0940–1.0952, 1.1011, 1.1088, 1.1132–1.1140, 1.1198–1.1218, 1.1267–1.1292, 1.1354–1.1363, 1.1413–1.1424, 1.1474–1.1481, 1.1513, 1.1548, 1.1571, and 1.1607–1.1622. No significant events are scheduled in the Eurozone or the U.S. for Monday, but information from Donald Trump that could shake the markets might come at any time. If not, a flat market is likely.
Support and Resistance Levels: These are target levels for opening or closing positions and can also serve as points for placing Take Profit orders.
Red Lines: Channels or trendlines indicating the current trend and the preferred direction for trading.
MACD Indicator (14,22,3): A histogram and signal line used as a supplementary source of trading signals.
Important Events and Reports: Found in the economic calendar, these can heavily influence price movements. Exercise caution or exit the market during their release to avoid sharp reversals.
Forex trading beginners should remember that not every trade will be profitable. Developing a clear strategy and practicing proper money management are essential for long-term trading success.


