Veja também

 24.06.2025 06:57 AM
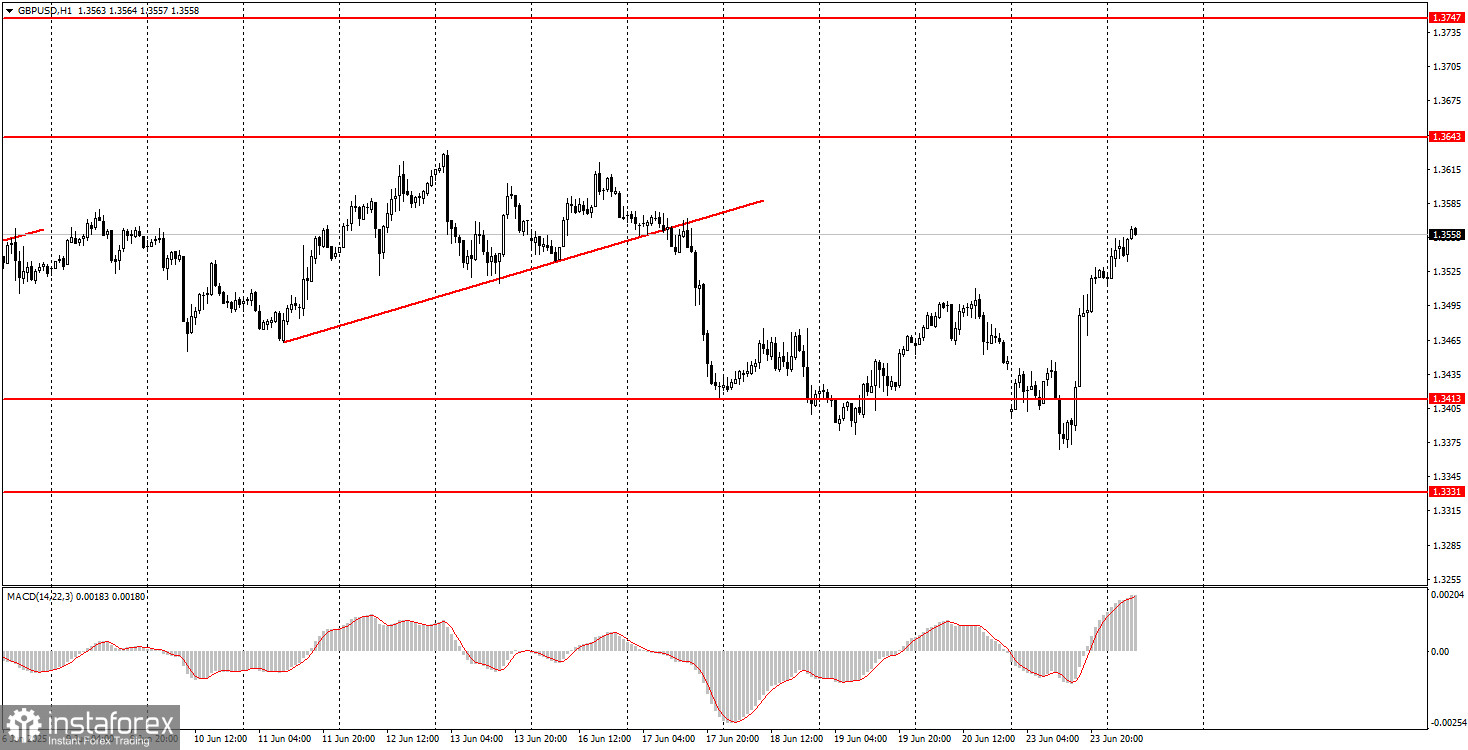
The GBP/USD pair also showed quite a strong upward move by the end of Monday. The rally began during the U.S. trading session, just when most traders had already lost hope of any reaction to the escalation of the Middle East conflict and the U.S. entering a war against Iran. But, as often happens, the movement began when no one expected it anymore.
The dollar strengthened slightly in the first half of the day, but as we had warned, it failed to demonstrate a significant rally. This is because the issue now is not merely increased tensions in the Middle East but America's entry into military confrontation with Iran. Already yesterday, reports emerged of Iranian attacks on American military bases in the region. Although Trump does not want to retaliate against Iran with further strikes, everything revolves around the so-called ceasefire. As long as Iran does not abandon its nuclear development, Trump will continue to pressure the country. Therefore, there is no sign of de-escalation — neither of this conflict nor of the global trade war. Now, the U.S. is officially involved in its second international conflict.
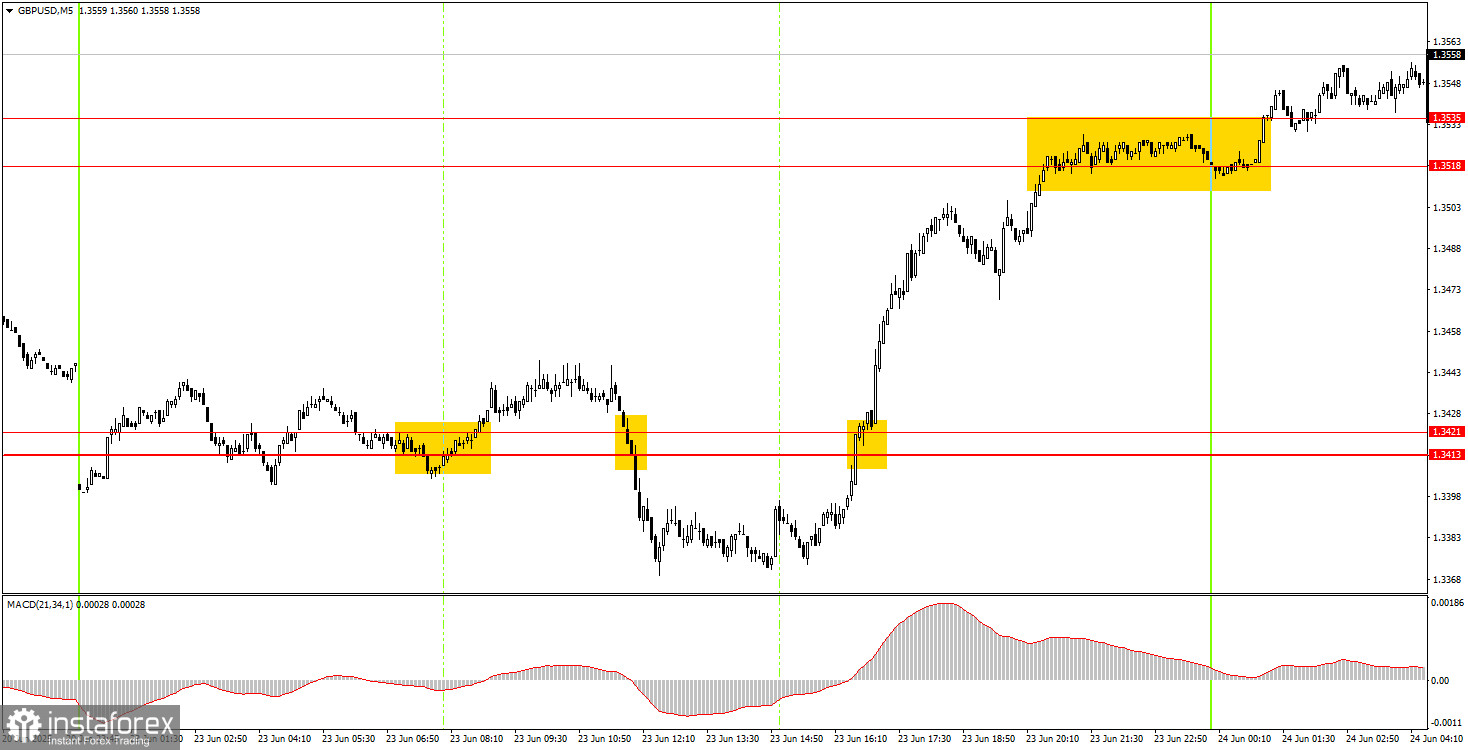
In the 5-minute timeframe, several signals were formed on Monday, as the price did not remain still throughout the day. Unfortunately, the first two trading signals are unreliable since the main movement started only during the U.S. session. The first buy signal near the 1.3413–1.3421 area turned out to be false and resulted in a small loss due to a stop-loss hit. The second sell signal around the same area was also false, but the price did move 30 pips in the correct direction, so the Stop Loss was triggered at breakeven. The third signal was strong, and the price reached the nearest target area of 1.3518–1.3535, which could yield solid profits.
On the hourly timeframe, the GBP/USD pair continues to track closely with developments around Donald Trump and remains highly skeptical of his policies. Therefore, the market either keeps selling the dollar or waits for more negative news from overseas to resume selling it. This will likely continue until the market sees real signs of the trade war coming to an end or until Trump stops making decisions that he has no authority to make, which leaves market participants stunned. The dollar may occasionally gain some value, but such instances are currently quite rare.
On Tuesday, the GBP/USD pair may continue its upward move, as the previous downtrend appears to have ended. The U.S.'s military engagement against Iran has worked against the dollar.
Relevant trading levels to consider: 1.3043, 1.3102–1.3107, 1.3203–1.3211, 1.3259, 1.3329–1.3331, 1.3413–1.3421, 1.3518–1.3535, 1.3580–1.3592, 1.3643–1.3652, 1.3695, 1.3740. As for notable events on Tuesday, only Jerome Powell's speech stands out. However, under the current circumstances, it is unlikely that Powell will share any important information with the market.
Support and Resistance Levels: These are target levels for opening or closing positions and can also serve as points for placing Take Profit orders.
Red Lines: Channels or trendlines indicating the current trend and the preferred direction for trading.
MACD Indicator (14,22,3): A histogram and signal line used as a supplementary source of trading signals.
Important Events and Reports: Found in the economic calendar, these can heavily influence price movements. Exercise caution or exit the market during their release to avoid sharp reversals.
Forex trading beginners should remember that not every trade will be profitable. Developing a clear strategy and practicing proper money management are essential for long-term trading success.


