Veja também

 30.06.2025 09:08 AM
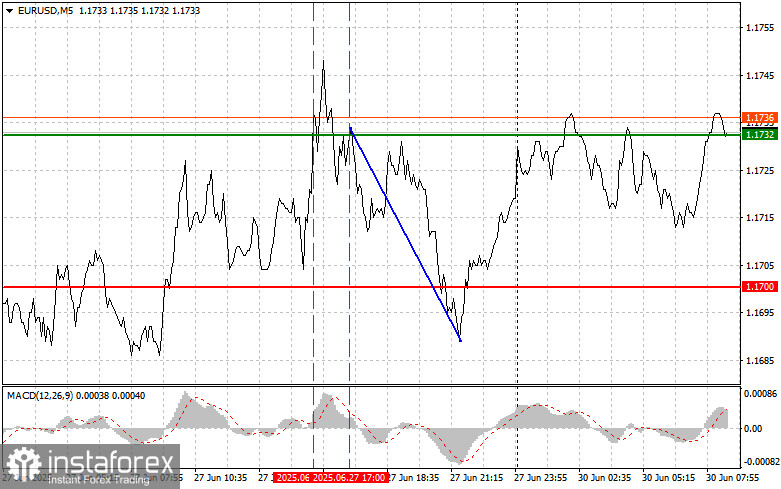
The price test at 1.1732 occurred when the MACD indicator had already moved significantly above the zero mark, which limited the pair's upward potential. For this reason, I did not buy the euro. The second test of this price occurred when the MACD was in the overbought zone, allowing Scenario #2 for selling to be realized, resulting in a 30-point drop in the pair.
The U.S. May Core Personal Consumption Expenditures (PCE) index, a key inflation indicator, rose by 0.2%, slightly ahead of economists' expectations. At the same time, data on American incomes and expenditures signaled weakening inflationary pressures, which became a restraining factor for demand for the U.S. dollar. Although the PCE index slightly exceeded forecasts, the overall picture points to a gradual decline in inflation.
Today, it promises to bring market participants a range of key economic reports. Investors will focus on indicators reflecting consumer demand and inflation in the leading eurozone economies. The publication of consumer price indices in France and Germany will provide insight into price growth. Analysts will closely examine these figures to determine how effectively the European Central Bank is implementing its price control policy. Any deviation from forecasted values may cause fluctuations in the financial markets and affect the value of the euro.
Additionally, data on private sector lending in the eurozone is scheduled for release. This indicator reflects the volume of borrowed funds attracted by businesses and households, serving as a key indicator of economic development. A rise in lending volumes may indicate increased business activity and growing consumer confidence, while a decline may point to a slowdown in economic growth. Altogether, these data will offer important insights into the state of the European economy and help investors form a clearer view of growth and inflation prospects.
For intraday strategy, I will focus primarily on Scenarios #1 and #2.
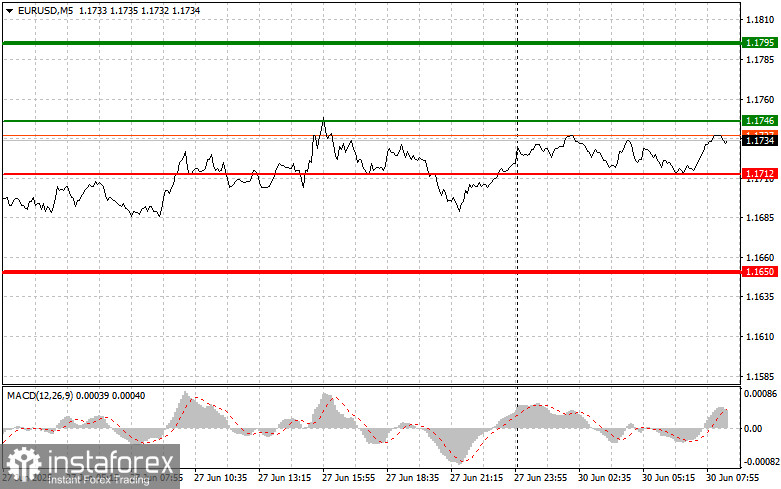
Scenario #1: Today, I plan to buy the euro upon reaching the 1.1746 area (indicated by the green line on the chart), with a target of rising to the 1.1795 level. At 1.1795, I plan to exit the market and open short positions in the opposite direction, aiming for a move of 30–35 points from the entry point. Buying the euro today will be reasonable after strong data.
Important! Before buying, ensure the MACD indicator is above the zero mark and is just starting to rise from it.
Scenario #2: I also plan to buy the euro today in case of two consecutive tests of the 1.1712 price level while the MACD indicator is in the oversold zone. This will limit the pair's downside potential and lead to an upward reversal. A rise to the opposite levels of 1.1746 and 1.1795 can be expected.
Scenario #1: I plan to sell the euro once it reaches the 1.1712 level (indicated by the red line on the chart). The target will be 1.1650, where I plan to exit the market and immediately open long positions in the opposite direction (aiming for a 20–25 point rebound). Pressure on the pair may return today if there is weak data.
Important! Before selling, ensure the MACD indicator is below the zero mark and is just starting to decline from it.
Scenario #2: I also plan to sell the euro today in case of two consecutive tests of the 1.1746 level while the MACD indicator is in the overbought zone. This will limit the pair's upward potential and lead to a downward reversal. A decline to the opposite levels of 1.1712 and 1.1650 can be expected.