Veja também

 14.07.2025 11:40 AM
Trend Analysis
This week, from the level of 1.3487 (the close of the last weekly candle), the price may continue to decline toward the target of 1.3374 — the 23.6% retracement level (red dashed line). Upon testing this level, the price may start moving upward toward the target of 1.3420 — the 13-period EMA (thin yellow line).
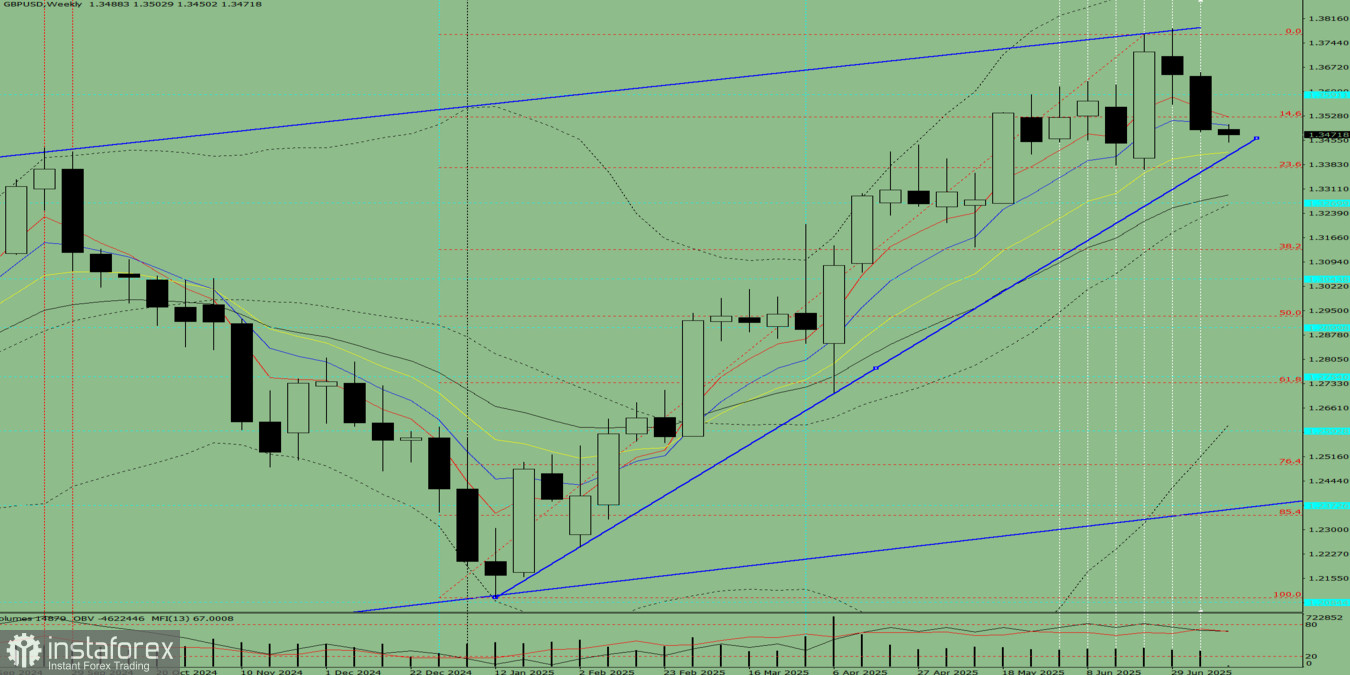
Fig. 1 (weekly chart)
Comprehensive Analysis:
Conclusion based on comprehensive analysis: downward movement
General forecast for the GBP/USD weekly candle:The price is likely to trend downward during the week, with no upper shadow on the weekly black candle (Monday – down) and the presence of a lower shadow (Friday – up).
Alternative scenario:From the 1.3487 level (the close of the last weekly candle), the price may continue to move down toward the target of 1.3374 — the 23.6% retracement level (red dashed line). If this level is reached, the downward movement may extend further toward 1.3294 — the 21-period EMA (thin black line).
You have already liked this post today
*A análise de mercado aqui postada destina-se a aumentar o seu conhecimento, mas não dar instruções para fazer uma negociação.


