Veja também

 07.08.2025 05:07 AM
On the daily chart, a bullish divergence has formed between the price and the Marlin oscillator. The price has already moved above the target level of 3.086; all that remains is to consolidate above it (i.e., close the day with a white candlestick) to confidently move toward testing resistance at the MACD line (3.193).
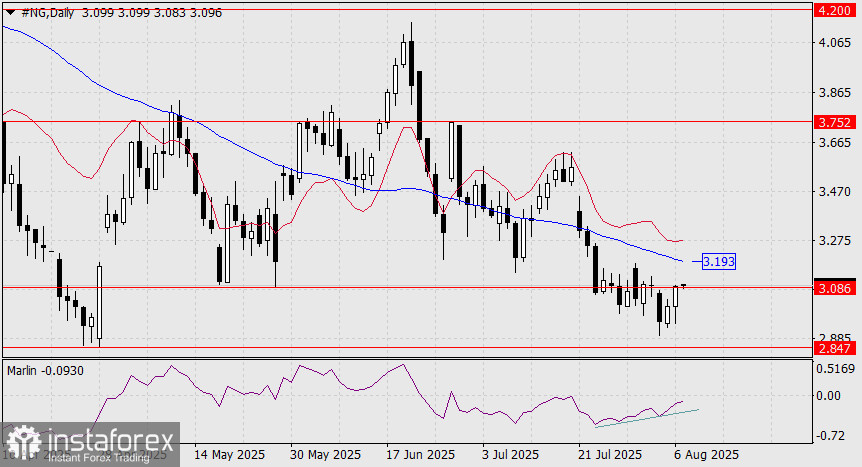
A firm break above the MACD line would open the path toward the high target at 3.752 – a strong resistance level observed on June 3 and 27, and May 5.
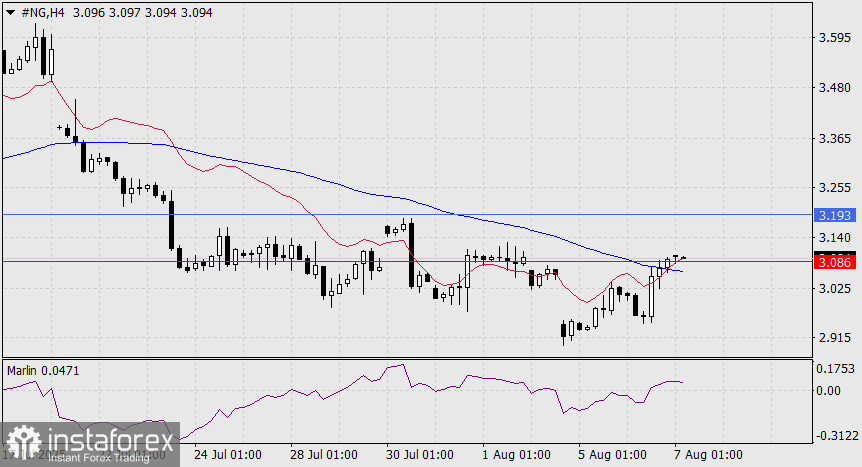
On the four-hour chart, the price has consolidated above both indicator lines and above the resistance level of 3.086. The Marlin oscillator has also settled in the bullish territory, confirming a fully upward setup. Now, attention turns to the price behavior at the 3.193 level.
You have already liked this post today
*A análise de mercado aqui postada destina-se a aumentar o seu conhecimento, mas não dar instruções para fazer uma negociação.


