Veja também

 11.08.2025 09:40 AM
Trend Analysis (Fig. 1).
On Monday, from the 1.1641 level (Friday's daily candle close), the market may begin moving upward toward 1.1689 – a historical resistance level (blue dotted line). Upon testing this level, the price may start moving downward toward 1.1653 – the 14.6% retracement level (blue dotted line). If this level is reached, the downward movement could continue toward 1.1626 – the 23.6% retracement level (blue dotted line).
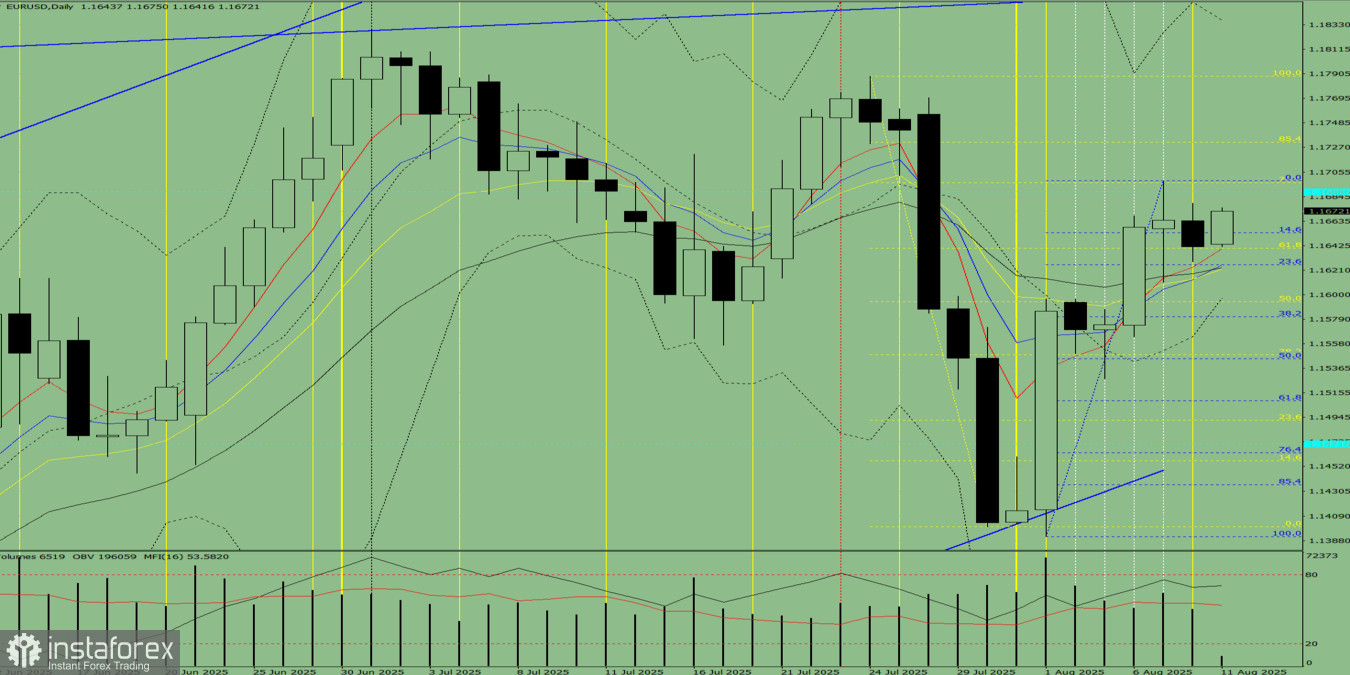
Fig. 1 (Daily Chart).
Comprehensive Analysis:
Overall conclusion: upward trend.
Alternative scenario: from the 1.1641 level (Friday's daily candle close), the price may start moving upward toward 1.1698 – the upper fractal (blue dotted line). Upon reaching this level, the price may then move downward toward 1.1653 – the 14.6% retracement level (blue dotted line).
You have already liked this post today
*A análise de mercado aqui postada destina-se a aumentar o seu conhecimento, mas não dar instruções para fazer uma negociação.


