Veja também

 26.08.2025 04:21 AM
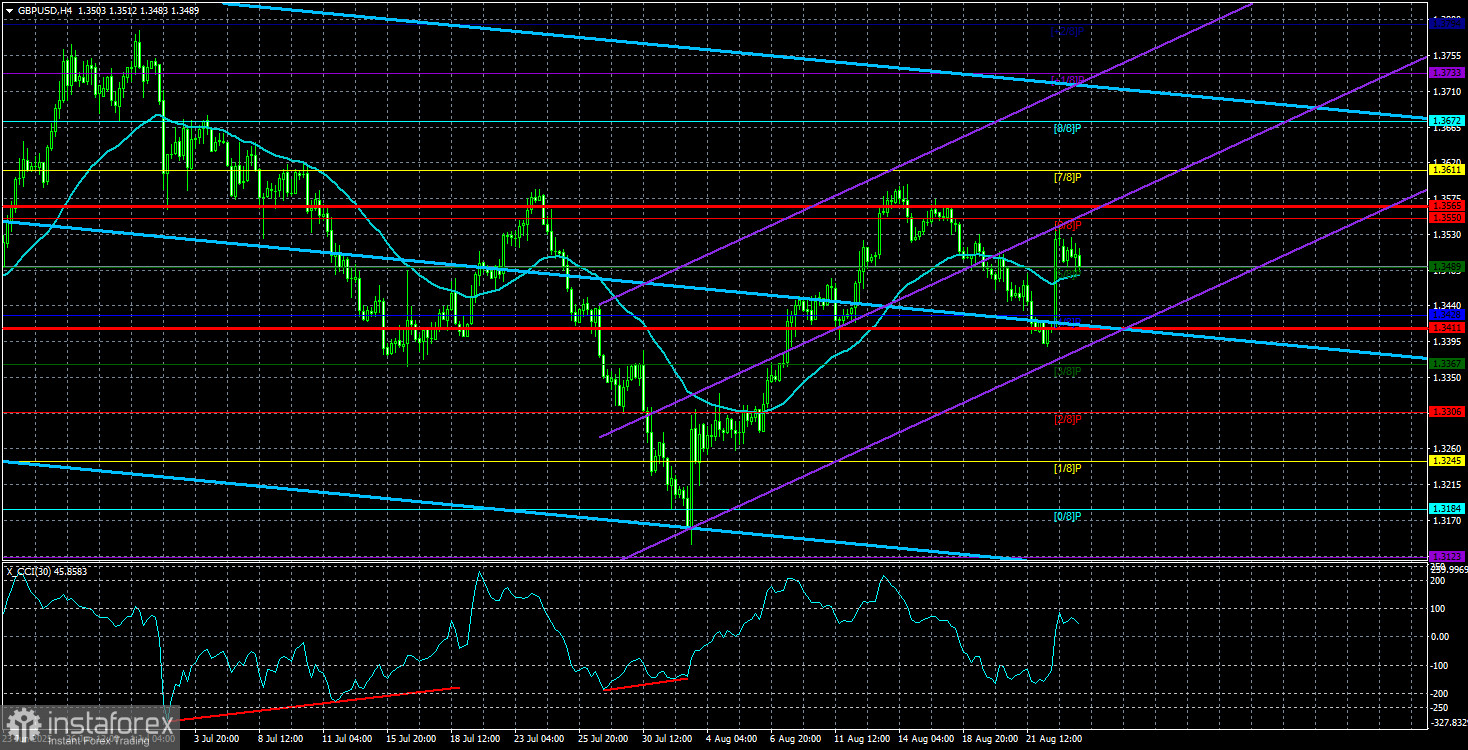
On Monday, the GBP/USD currency pair showed only minimal recovery after Friday's sharp rally, which most attributed to Jerome Powell's speech. Over the weekend, we already noted that Powell's rhetoric could hardly be described as resonant, unexpected, or dovish. If the Federal Reserve had allowed for two rounds of monetary easing this year from the very beginning, then what was so surprising about Powell admitting the possibility of a rate cut? Fed officials have repeatedly spoken of two cuts in 2025, which is also reflected in the dot plot. Thus, nothing extraordinary happened on Friday. Powell did not give any "green light" to easing—it has been ongoing since 2024 anyway. Yes, the pace has been slow, but it would have been faster if not for Donald Trump's trade policies. It was precisely the introduction of tariffs that forced the Fed to pause and assess its economic impact. In effect, the U.S. president shot himself in the foot.
So why did the dollar fall on Friday? To answer that, every trader must ask a different question: why is the market really expecting a Fed rate cut? Yes, FOMC members have consistently mentioned future easing, but they always specified the number of steps—two cuts in 2025. These two cuts have already been priced in multiple times since January. Yet the dollar plunged on Powell's contradictory remarks as though he had pledged to cut rates by a couple of percentage points. In reality, he and the FOMC hawks are still resisting Donald Trump—and we all know how difficult that is.
In our view, the dollar dropped because the market expects far more easing than just two 25-basis-point cuts. Why? Because Trump continues to pressure the Fed on all fronts. Because Powell will step down in May 2026. Because Adriana Kugler has already resigned. Because another hawk, Lisa Cook, may leave soon. Because Trump will continue shaping his FOMC, which will vote the way he wants.
Our conclusion is not encouraging. The GBP/USD pair, like any dollar pair, may trade sideways for months or correct, but this will not change the global fundamental backdrop, nor cancel the ongoing "anti-dollar trend." Therefore, we continue to expect only a decline in the U.S. currency. In the near future, the market may aim for the 1.40 level, which no longer looks like a "fantastical target," as it did at the start of the year.
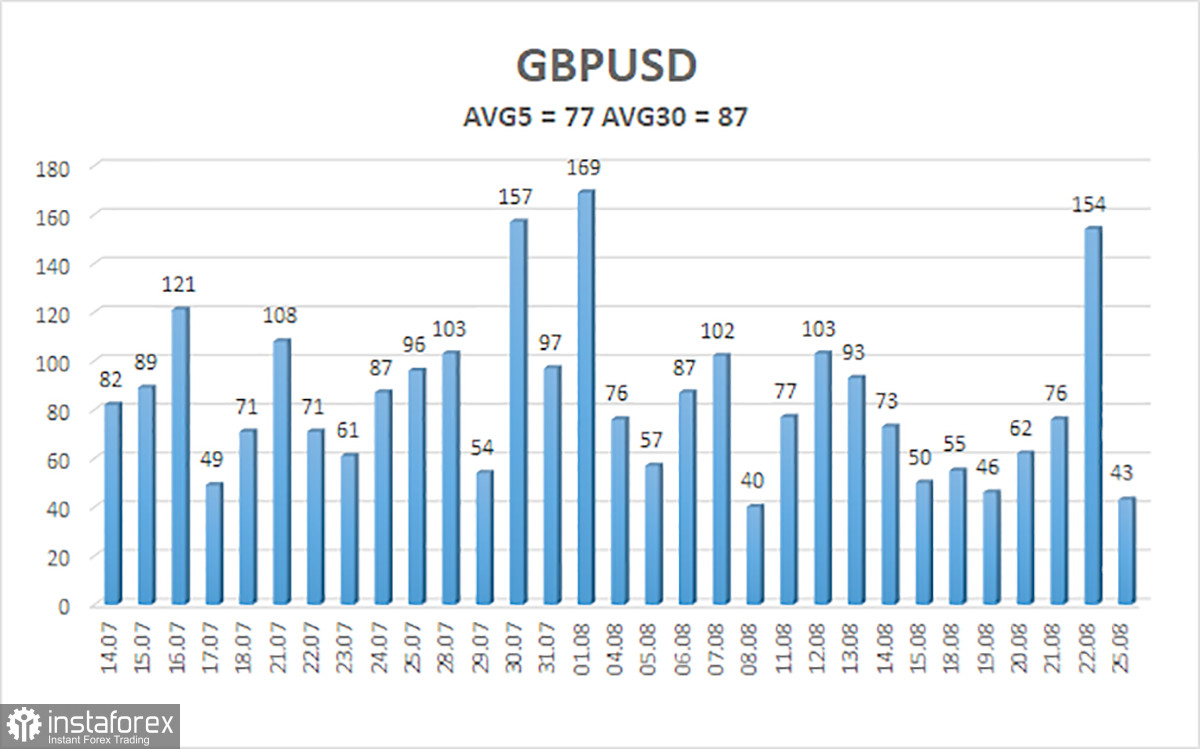
Average volatility of the GBP/USD pair over the last five trading days is 77 pips, considered "average." On Tuesday, August 26, we therefore expect movement within the range 1.3411–1.3565. The long-term linear regression channel is directed upward, indicating a clear uptrend. The CCI indicator has entered oversold territory twice, signaling a resumption of the bullish trend. Several bullish divergences also formed ahead of the new upward leg.
S1 – 1.3489
S2 – 1.3428
S3 – 1.3367
R1 – 1.3550
R2 – 1.3611
R3 – 1.3672
The GBP/USD pair has completed another downward correction. In the medium term, Trump's policies will likely continue to weigh on the dollar. Thus, long positions with targets at 1.3611 and 1.3672 remain preferable as long as the price stays above the moving average. A price move below the moving average would allow small shorts with a target of 1.3411 on purely technical grounds. The U.S. currency occasionally shows corrections, but for a sustained uptrend, it needs clear signs of the end of the global trade war.
Linear Regression Channels help determine the current trend. If both channels are aligned, it indicates a strong trend.
Moving Average Line (settings: 20,0, smoothed) defines the short-term trend and guides the trading direction.
Murray Levels act as target levels for movements and corrections.
Volatility Levels (red lines) represent the likely price range for the pair over the next 24 hours based on current volatility readings.
CCI Indicator: If it enters the oversold region (below -250) or overbought region (above +250), it signals an impending trend reversal in the opposite direction.


