Veja também

 26.08.2025 09:33 AM
Trend Analysis (Fig. 1).
On Tuesday, from the level of 1.1617 (yesterday's daily close), the market may continue moving downward toward the target at 1.1594 – the 50% retracement level (yellow dotted line). Upon testing this level, the price may bounce upward, aiming to retest the 38.2% retracement level at 1.1600 (blue dotted line).
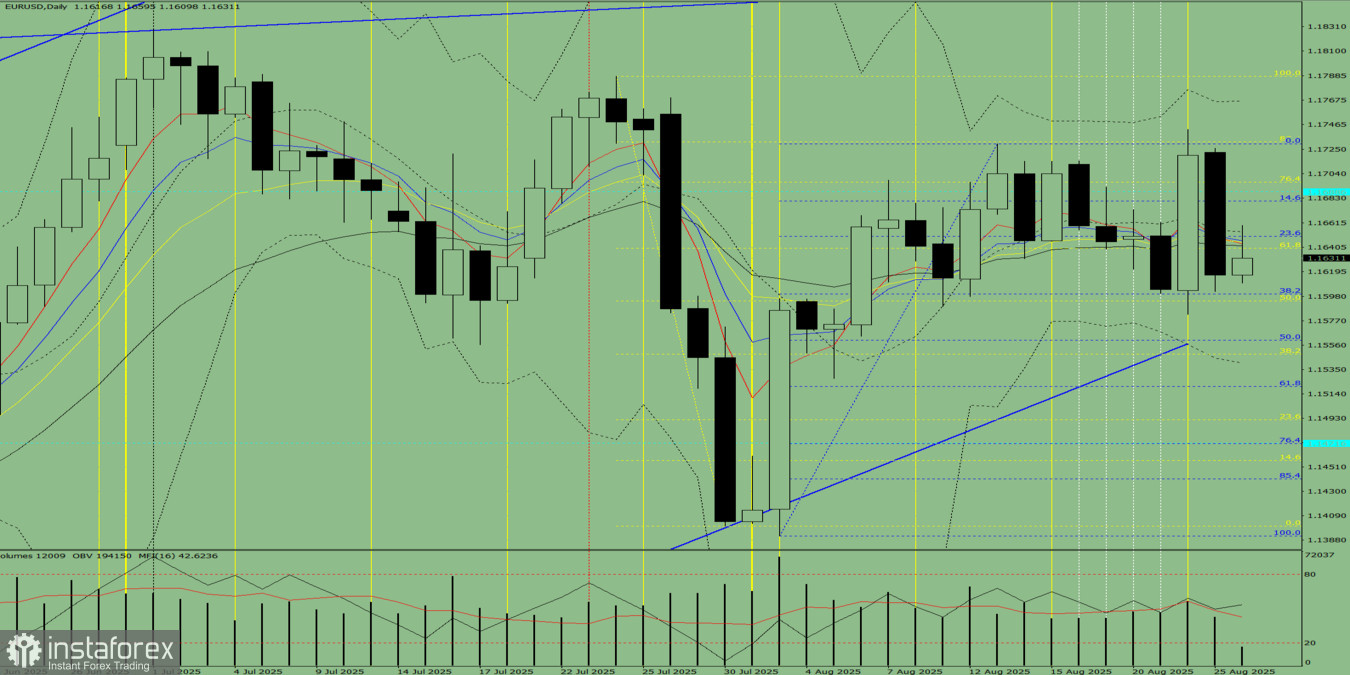
Fig. 1 (daily chart).
Comprehensive Analysis:
General Conclusion: Downward trend.
Alternative Scenario: From the level of 1.1617 (yesterday's daily close), the price may continue moving downward toward 1.1560 – the 50% retracement level (blue dotted line). Upon testing this level, the price may bounce upward toward the 38.2% retracement level at 1.1600 (blue dotted line).
You have already liked this post today
*A análise de mercado aqui postada destina-se a aumentar o seu conhecimento, mas não dar instruções para fazer uma negociação.


