Veja também

 28.08.2025 04:12 AM
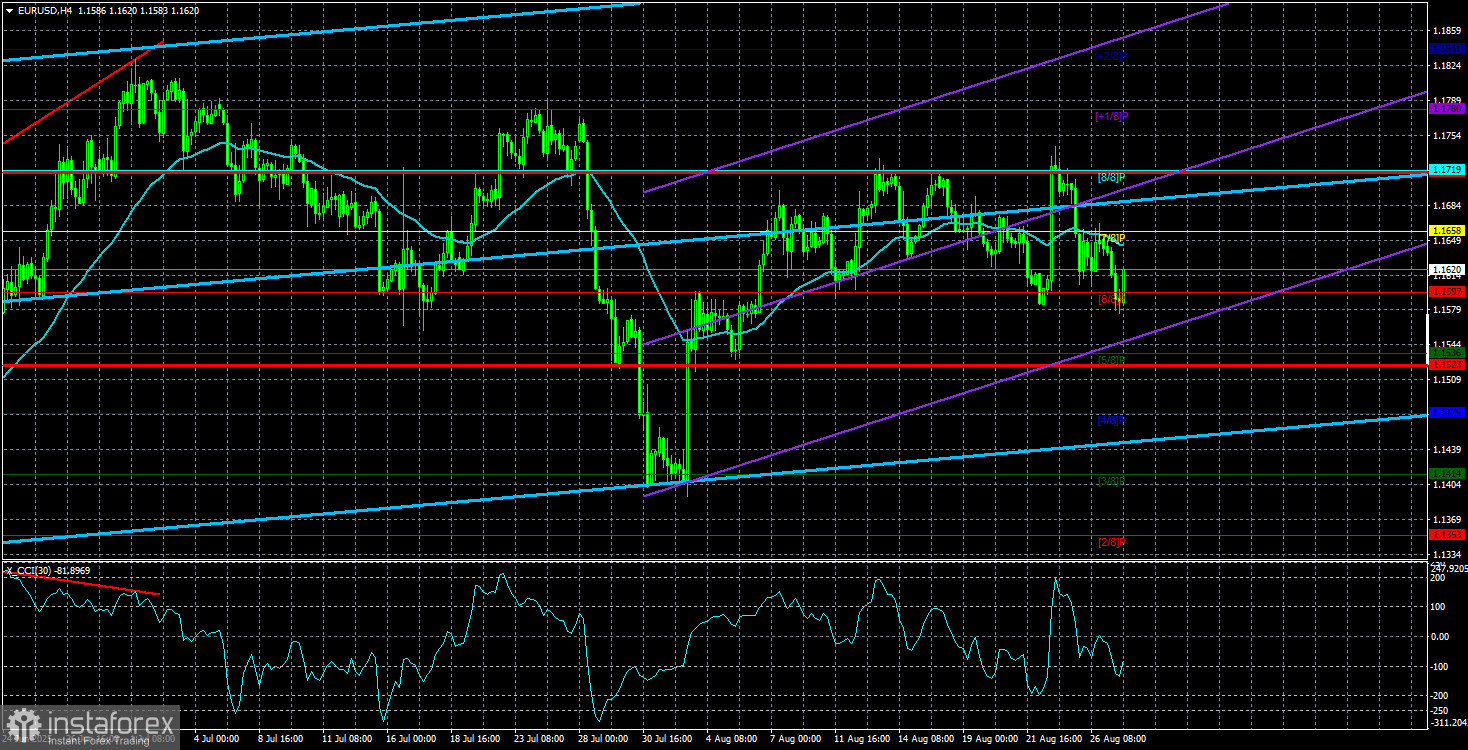
On Tuesday, the EUR/USD pair attempted to move lower once again. For many traders who closely follow news and analysis, the US dollar's persistence may seem strange. However, we don't see anything odd about it. Traders need to remember that the market spends most of its time in a flat (sideways) phase. Yes, flats account for the majority of trading time, not trends. Of course, not all flats are obvious—some are clear with well-defined boundaries, while others are complex corrective structures with no clear borders, but the price still trades in a range. That's a flat, too, in a broad sense. Therefore, traders who are currently wondering why the dollar is rising, despite widespread discussions about its weakness, shouldn't despair.
To understand what's happening, it's best to switch to the daily timeframe. What do we see on the daily chart? Nearly uninterrupted growth over seven months. In the last month or so, the price has been in the 1.14–1.18 range. That's also a flat, though on lower timeframes it may not be visible. If flat phases last much longer than trends, on the daily TF, they can last for months. Such price movement is primarily driven by the trading style and position-building of major players, namely market makers. A large player may take weeks to build their position. Usually, it's built during flats, not when the price is already surging up or down.
Retail traders want to open trades every day—and preferably profit every day—but the market doesn't work that way. And market makers, who move the market, don't trade like that either. So, one way or another, retail traders need to adjust to what big capital is doing. The moral of the story? The dollar still has no grounds for sustainable growth. Many may wonder: why isn't the dollar falling, if things are so bad for it? Simply because the market is in another flat phase now. It's also possible that big capital is currently building new long positions. Or perhaps it's time for a more substantial correction. Thus, our expectations for the dollar won't change—even if EUR/USD falls below 1.1400.
Of course, fundamentals may change over time. In the last few weeks, we've seen that Donald Trump has barely imposed new tariffs, hasn't raised existing ones, and has focused mostly on resolving the Ukraine-Russia conflict. Naturally, Nobel Prize laureates will be announced in October, and Trump is eager to receive that award. But to earn it, he has to be a peacemaker in deeds, not just words. A real end to the conflict is required. So Trump has devoted all efforts to achieve a truce between Moscow and Kyiv. There are still no significant results, but at least things have moved off dead center. For the dollar, such a lull is an opportunity to take a breather from the persistent decline.
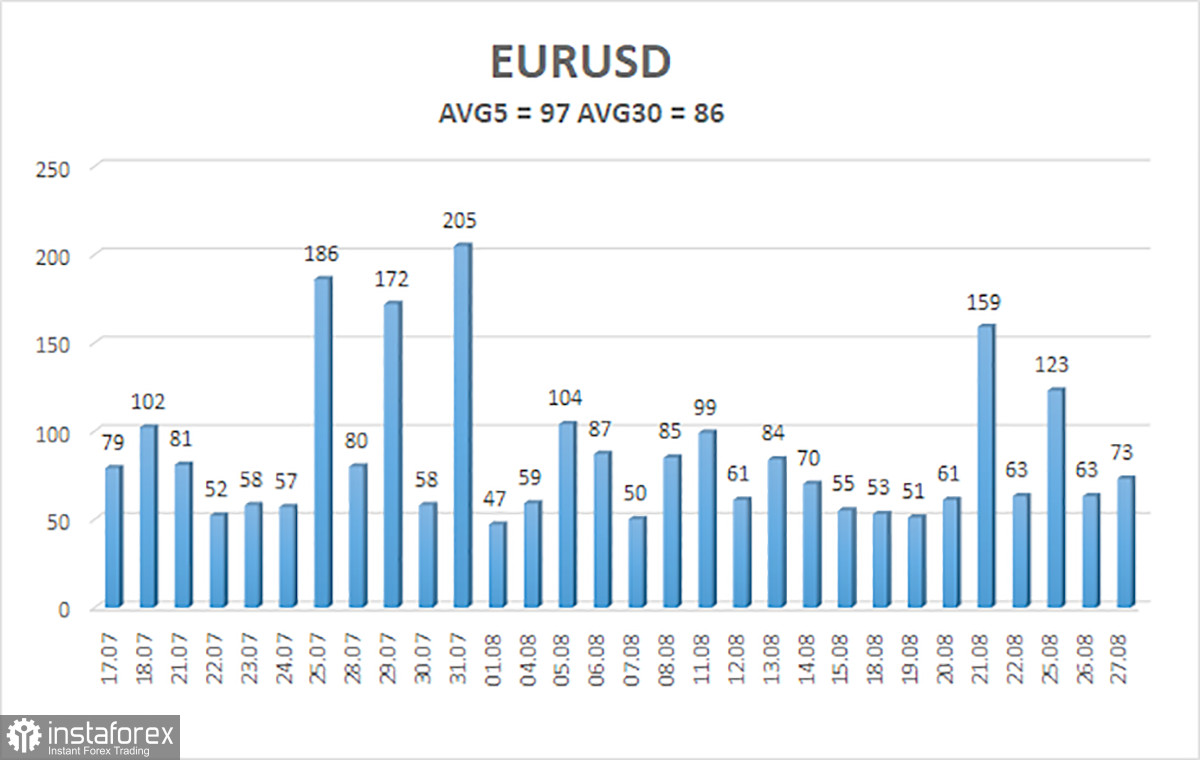
The average volatility of EUR/USD over the past five trading days as of August 28 is 97 pips—considered "average." On Thursday, we expect movement between 1.1523 and 1.1717. The upper linear regression channel is pointing up, still signaling an uptrend. The CCI indicator dipped into oversold territory three times, signaling a potential renewed upward movement.
S1 – 1.1597
S2 – 1.1536
S3 – 1.1475
R1 – 1.1658
R2 – 1.1719
R3 – 1.1780
The EUR/USD pair can resume its uptrend. US dollar dynamics are still heavily influenced by Trump's policies, and he's not planning to "stop at what's been achieved." The dollar has risen as much as it could, but now it seems we're entering a new long stretch of decline. If the price is below the moving average, small shorts targeting 1.1597 and 1.1523 are possible. Above the moving average, long positions targeting 1.1719 and 1.1748 remain relevant if the trend continues.


