Veja também

 15.09.2025 11:55 AM
Trend analysis (Fig. 1).
On Monday, from the level of 1.3556 (the closing of Friday's daily candle), the market may start moving upward toward 1.3593 – the upper fractal (yellow dashed line). Upon testing this line, the price may then move downward toward 1.3582 – the upper fractal (daily candle of September 11, 2025).
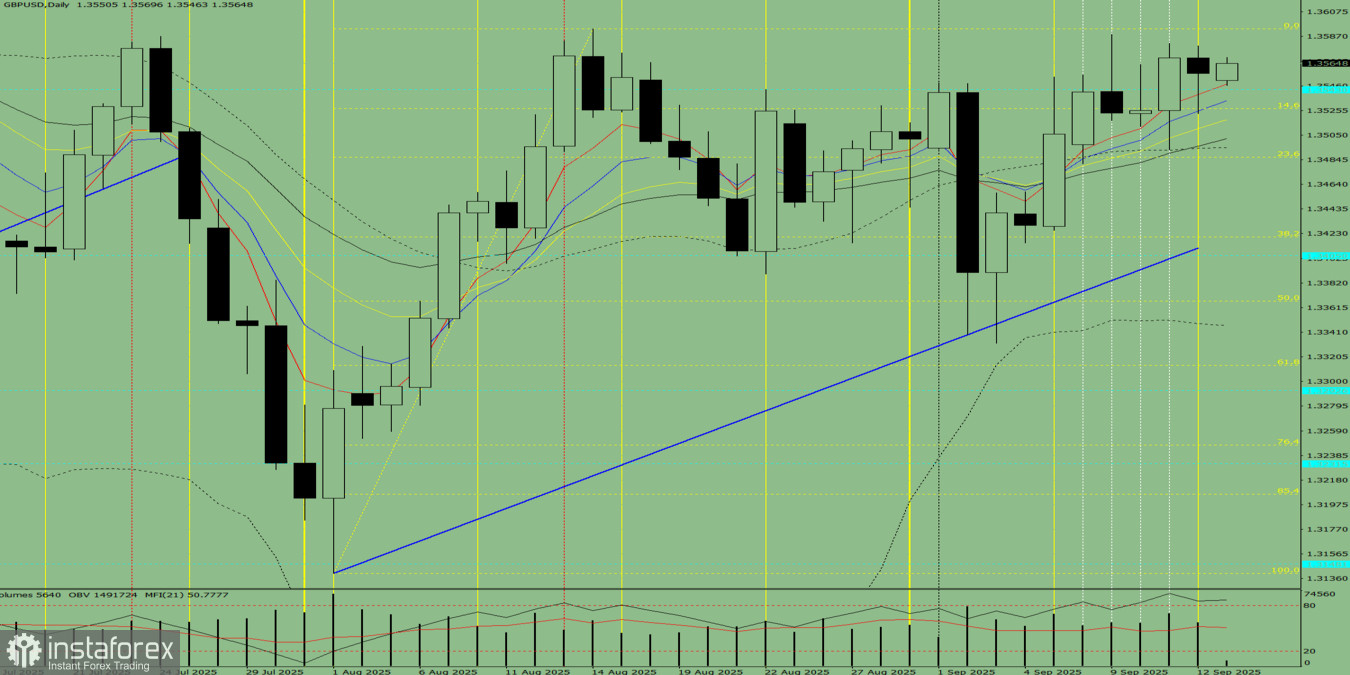
Fig. 1 (daily chart).
Comprehensive analysis:
Overall conclusion: upward trend.
Alternative scenario: from the level of 1.3556 (the closing of Friday's daily candle), the price may start moving upward toward 1.3582 – the upper fractal (daily candle of September 11, 2025). Upon testing this level, the price may then move downward toward 1.3543 – the historical support level (blue dashed line).
You have already liked this post today
*A análise de mercado aqui postada destina-se a aumentar o seu conhecimento, mas não dar instruções para fazer uma negociação.


