Veja também

 29.09.2025 10:41 AM
Trend analysis.
This week, from the level of 1.3400 (close to the last weekly candle), the price may continue moving downward with the target at 1.3270 – the historical support level (light blue dotted line). When testing this level, the price may retrace upward with the target at 1.3332 – the lower fractal (weekly candle of August 31, 2025).
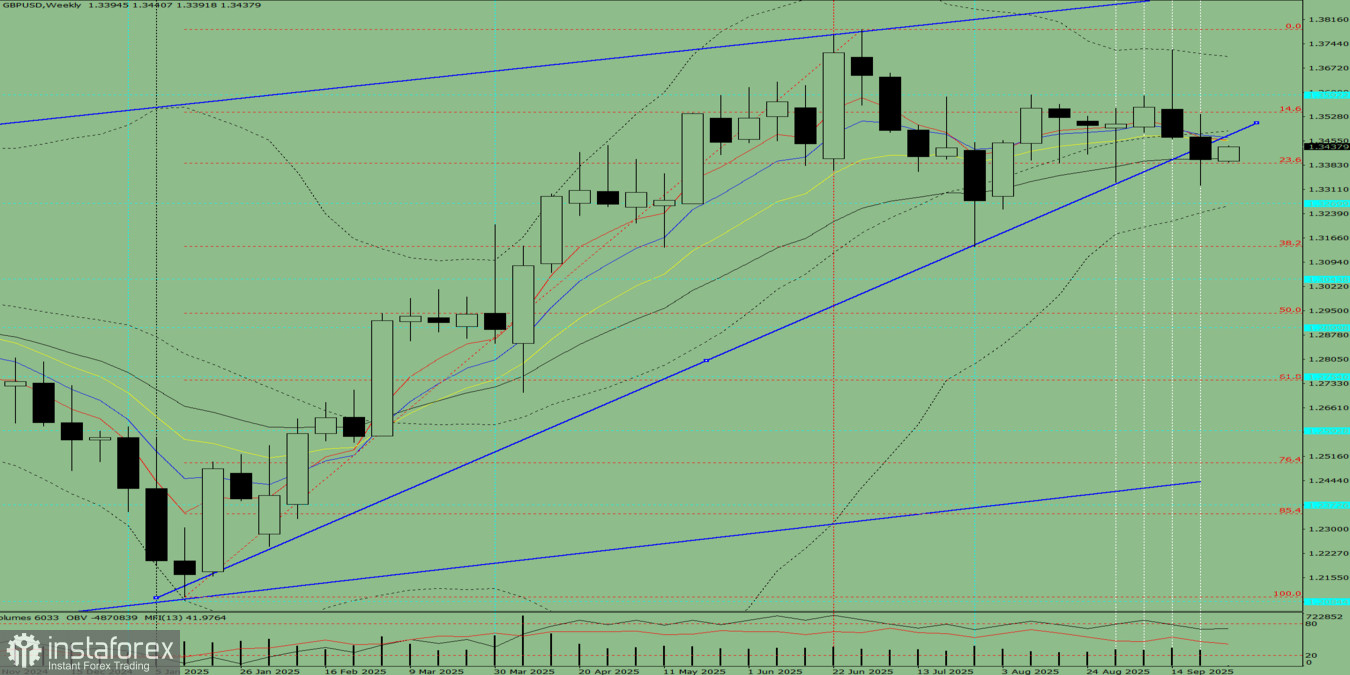
Fig. 1 (weekly chart).
Comprehensive analysis:
Overall outcome of the weekly candle calculation for GBP/USD: during the week, the price will most likely show a downward trend, with the first upper shadow on the weekly black candle (Monday – upward) and the second lower shadow (Friday – upward).
Alternative scenario: from the level of 1.3400 (close of the last weekly candle), the price may continue moving downward with the target at 1.3141 – the 38.2% pullback level (red dotted line). Upon reaching this level, an upward move is possible with the target at 1.3270 – the historical support level (light blue dotted line).
You have already liked this post today
*A análise de mercado aqui postada destina-se a aumentar o seu conhecimento, mas não dar instruções para fazer uma negociação.


