
Veja também


 21.07.2026 06:46 AM
Bitcoin has recovered by about $7,000 and is likely to continue moving toward the only bearish FVG on the daily chart. In any case, on the daily timeframe, this is the only area of POI (point of interest) for new short positions. It should be remembered that any rise in Bitcoin at this time is a correction, and corrections can end at any moment—not necessarily within any particular pattern. Bitcoin continues to trade near its annual lows, and most independent and uninterested experts predict further declines. We fully agree with these forecasts and believe that the downward trend is not over. There are no signs indicating the end of the bearish trend: no bullish patterns or breaks in the bearish structure. The fundamental backdrop also remains negative: the Federal Reserve does not intend to lower the key rate in 2026, capital continues to flow into the AI sector, spot demand for Bitcoin remains weak, geopolitics remains unstable, and miners are adapting their equipment to the requirements of artificial intelligence. We see no reason for a strong rise in "digital gold."
Meanwhile, Galaxy Digital CEO Mike Novogratz stated that several specific conditions need to be met for a new "bullish rally" to occur. Otherwise, Bitcoin will continue to trade within the current range. Novogratz believes that legislation must emerge in the U.S. clearly defining the regulatory framework for the cryptocurrency sector for Bitcoin to rise again. In addition, the Fed must resume easing monetary policy, and investors must rekindle their demand for Bitcoin. Novogratz also noted that the constantly rising U.S. national debt strengthens Bitcoin's long-term prospects, as cryptocurrency continues to serve as a tool for value preservation. In our view, the CEO of Galaxy Digital is absolutely correct, but therein lies the problem—investors currently do not intend to increase their Bitcoin purchases. The Fed is unlikely to return to easing policy anytime soon, and the Clarity Act bill is stuck in the U.S. Congress. Thus, we do not see grounds for a new upward trend in the near future.
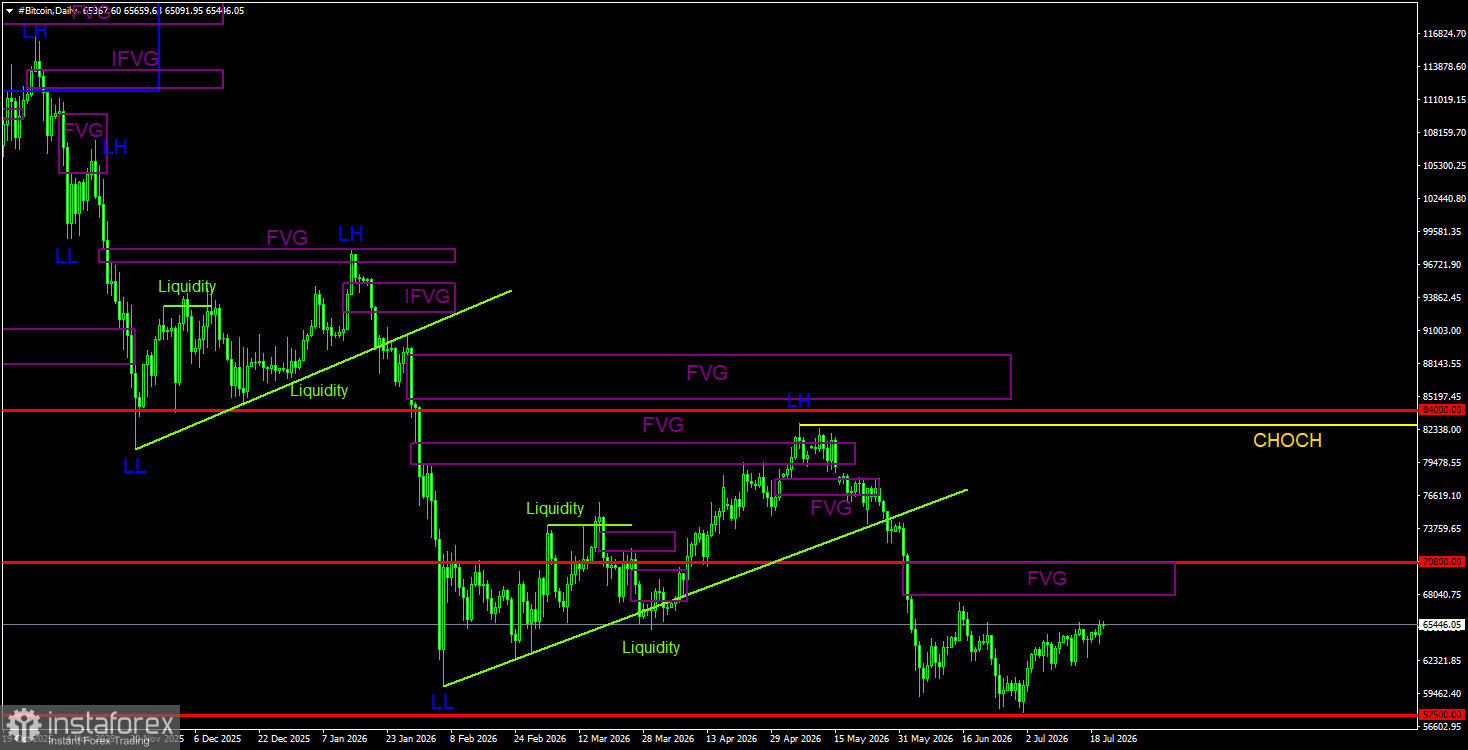
On the daily timeframe, Bitcoin continues to form a downward trend. The trend structure is identified as descending, and the CHOCH (Change of Character) line is now at $82,800, as a new LL (Lower Low) has been formed. Only above this level can it be considered that the downward trend is over. As there are still no signals indicating a reversal towards an upward trend, we believe that the decline will continue. A bearish FVG has formed in the area of $68,000 - $70,700, which serves as the only area of POI for sell positions.
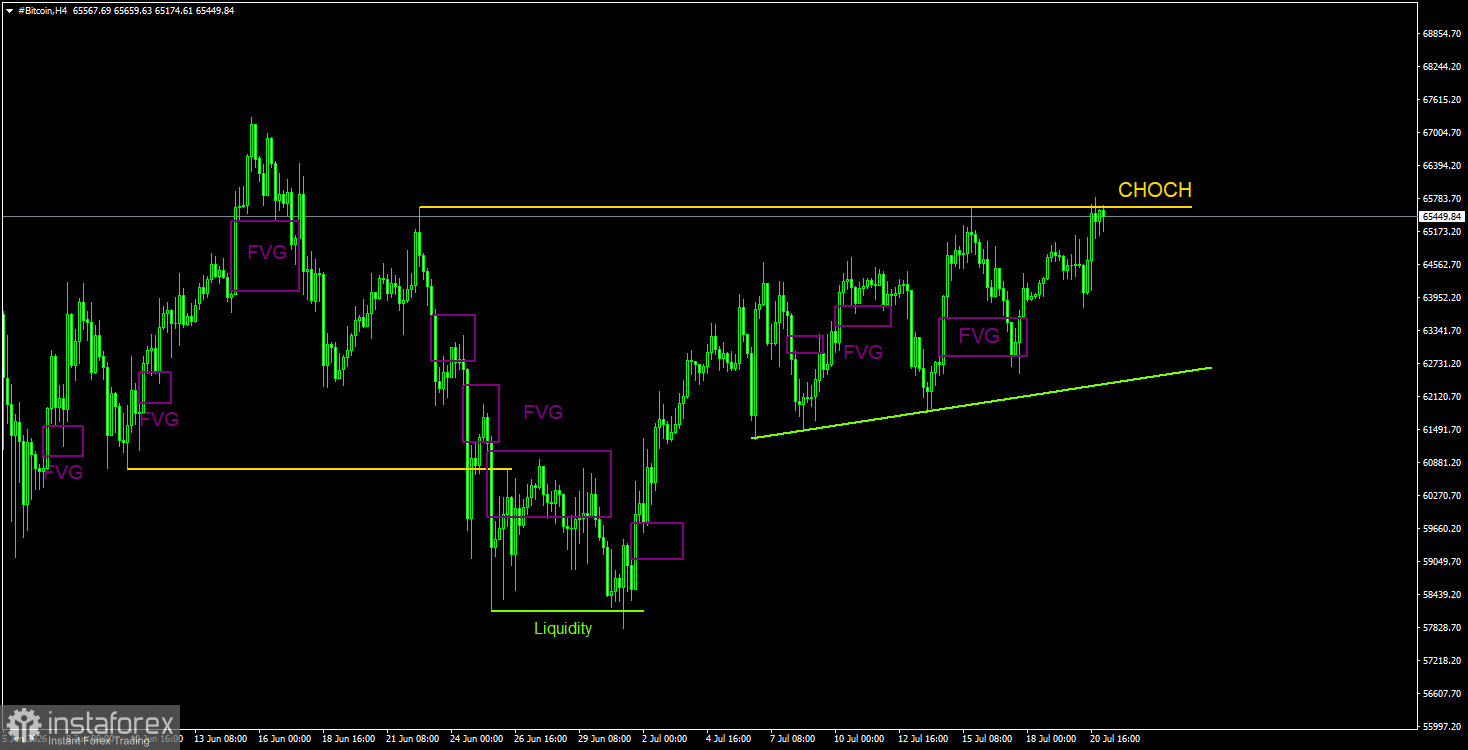
On the 4-hour timeframe, Bitcoin is in a downward trend; however, the general correction is not yet complete. After liquidity was taken on the buy side, a rise began, as we had warned. Recently, only small, local FVGs have been forming, the reaction to which has generally been very weak. The last formed FVG is bullish. The price reacted to it, providing traders with the opportunity to open long positions. However, we remind you that any rise in Bitcoin now is a correction. Whether to capitalize on the correction is a decision each trader makes for themselves. We also note the liquidity pool below the trend line, which the price may revisit with a 90% probability. We expect a new decline.
Bitcoin continues to form a full-fledged downward trend. We continue to anticipate a decline with a target of $57,500 (the 61.8% Fibonacci level from a three-year upward trend), although this level has essentially already been tested. However, we do not believe that the downward trend will conclude here. The last bearish FVG pattern was formed in the area of $68,000 - $70,700 on the daily timeframe, so this area serves as a POI for short positions in the coming weeks. On the 4-hour timeframe, Bitcoin continues its second wave of correction, but sell trades remain more attractive, as any rise right now is inherently a correction.


