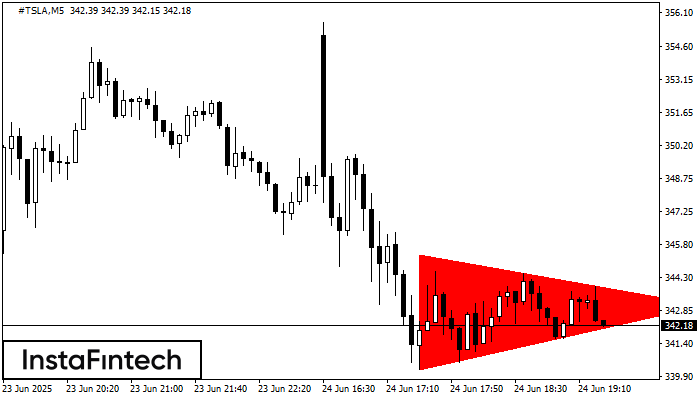
Bearish Symmetrical Triangle
was formed on 24.06 at 18:25:13 (UTC+0)
signal strength 1 of 5

According to the chart of M5, #TSLA formed the Bearish Symmetrical Triangle pattern. This pattern signals a further downward trend in case the lower border 340.23 is breached. Here, a hypothetical profit will equal the width of the available pattern that is -511 pips.
The M5 and M15 time frames may have more false entry points.
Figure
Instrument
Timeframe
Trend
Signal Strength


