Actual patterns

Patterns are graphical models which are formed in the chart by the price. According to one of the technical analysis postulates, history (price movement) repeats itself. It means that the price movements are often similar in the same situations which makes it possible to predict the further development of the situation with a high probability.
Relevant patterns by InstaTrade is an easy-to-use service which allows you to be aware of latest changes in the market and react to clues from the market in time. In our service you will always find the latest and most relevant patterns on any pair and any timeframe.
Head and Shoulders
was formed on 04.06 at 21:56:17 (UTC+0)
signal strength 1 of 5
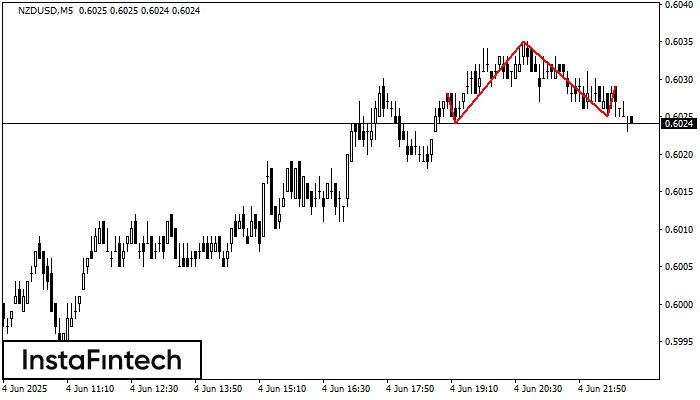
According to the chart of M5, NZDUSD formed the Head and Shoulders pattern. The Head’s top is set at 0.6035 while the median line of the Neck is found at 0.6024/0.6025. The formation of the Head and Shoulders pattern evidently signals a reversal of the upward trend. In other words, in case the scenario comes true, the price of NZDUSD will go towards 0.6010.
The M5 and M15 time frames may have more false entry points.
- All
- All
- Bearish Rectangle
- Bearish Symmetrical Triangle
- Bearish Symmetrical Triangle
- Bullish Rectangle
- Double Top
- Double Top
- Triple Bottom
- Triple Bottom
- Triple Top
- Triple Top
- All
- All
- Buy
- Sale
- All
- 1
- 2
- 3
- 4
- 5
Cabeza y Hombros
was formed on 20.06 at 00:30:27 (UTC+0)
signal strength 3 of 5
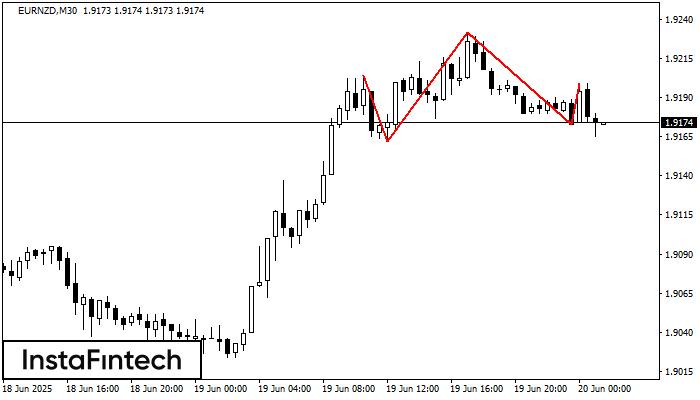
El patrón técnico llamado Cabeza y Hombros ha aparecido en el gráfico de EURNZD M30. Existen razones poderosas para sugerir que el precio superará la línea de cuello 1.9162/1.9173 después
Open chart in a new window
Doble Piso
was formed on 20.06 at 00:30:19 (UTC+0)
signal strength 3 of 5
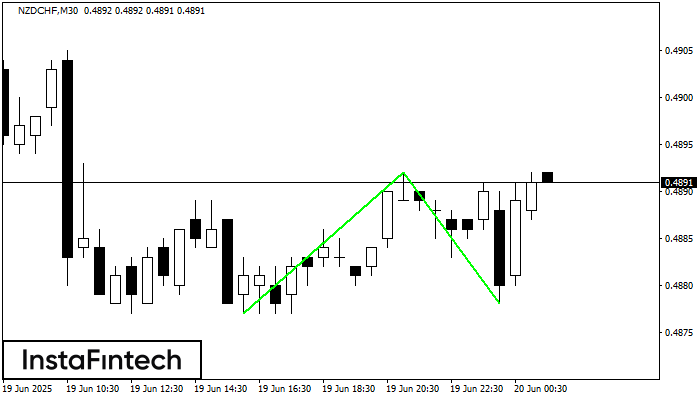
El patrón Doble Piso ha sido formado en NZDCHF M30; el límite superior es 0.4892; el límite inferior es 0.4878. El ancho del patrón es 15 puntos. En caso
Open chart in a new window
Cabeza y Hombros
was formed on 20.06 at 00:15:44 (UTC+0)
signal strength 2 of 5
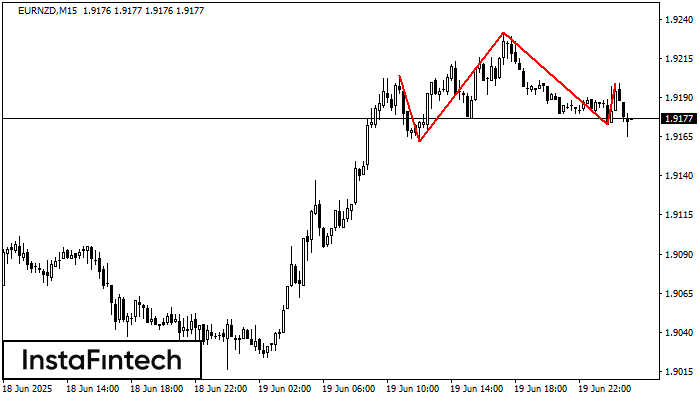
El EURNZD M15 formó el patrón Cabeza y Hombros con las siguientes características: El techo de la Cabeza se encuentra en 1.9232, la línea de cuello y el ángulo alcista
Los marcos de tiempo M5 y M15 pueden tener más puntos de entrada falsos.
Open chart in a new window