Vea también

 15.05.2025 06:46 AM
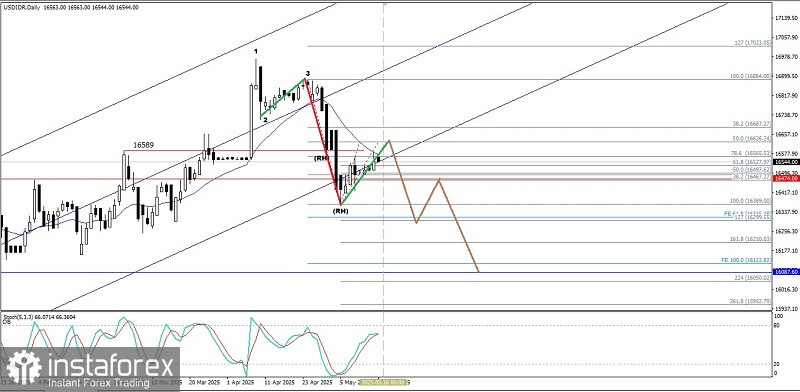
From what is seen on the daily chart, the Exotic USD/IDR currency pair appears to have a Bearish 123 pattern followed by the appearance of 2 Bearish Ross Hook (RH) which gives an indication that the USD currency is starting to weaken against the Garuda currency where the USD/IDR has also managed to break through and close below its Bullish channel which is also confirmed by its price movement which is moving below the WMA (21) with a decreasing slope, giving an indication that in the next few days, although the USD/IDR has the potential to test the 16626.24 level, as long as the strengthening does not break through and close above the 16687.27 level, the USD/IDR still has the potential to continue its weakening back to the 16299.55 level as its first target and if volatility and momentum support it, 16210.03 will be the next target to be aimed for.
(Disclaimer)
You have already liked this post today
*El análisis de mercado publicado aquí tiene la finalidad de incrementar su conocimiento, más no darle instrucciones para realizar una operación.


