Vea también

 28.05.2025 08:39 AM
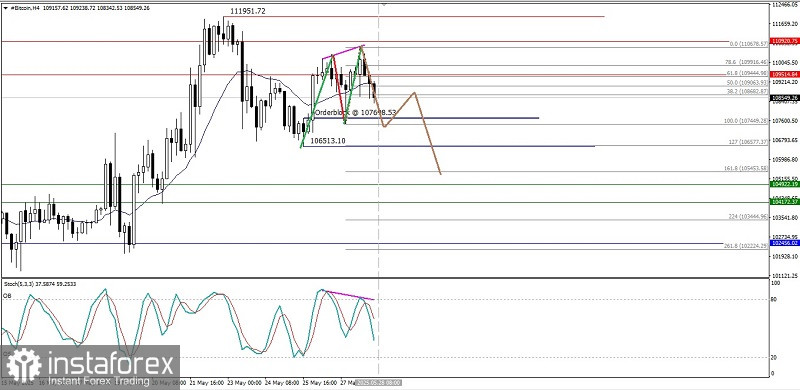
On the 4-hour chart of the Bitcoin cryptocurrency, there appears to be a Divergence between the Bitcoin price movement and the Stochastic Oscillator indicator, which indicates that in the near future Bitcoin has the potential to continue its decline, where the level of 107449.28 will be tested. If this support level is successfully broken and Bitcoin closes below that level, then #BTC has the potential to continue its decline to the level of 106577.37 and if momentum and volatility support it, Bitcoin will continue its decline again to the level of 105453.58, but if on its way to these levels Bitcoin suddenly strengthens again, breaks through and closes above the level of 110920.75, then all the previously described weakening scenarios will become invalid and automatically cancel themselves.
(Disclaimer)
You have already liked this post today
*El análisis de mercado publicado aquí tiene la finalidad de incrementar su conocimiento, más no darle instrucciones para realizar una operación.


