Vea también

 19.06.2025 11:45 AM
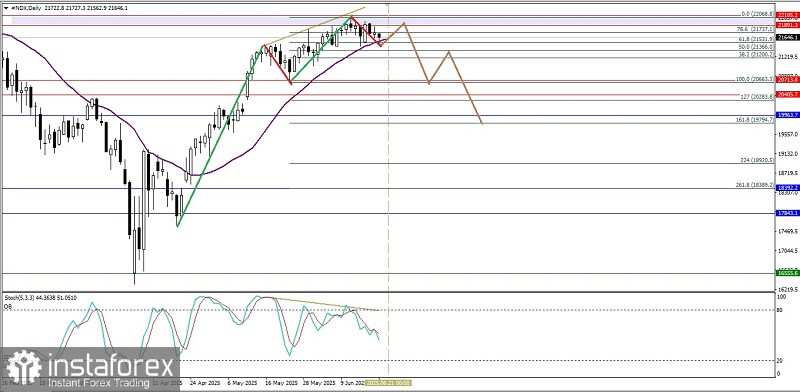
Although on its daily chart the Nasdaq 100 index appears to be moving above the WMA (30 Shift 2) which has a slope that is going upwards, but being stuck at the Resistance area level of 22105.2-21891.3 coupled with the appearance of Divergence between the #NDX price movement and the Stochastic Oscillator indicator, then in the next few days as long as there is no further strengthening that breaks through and closes above the level of 22068.8, #NDX has the potential to weaken down where the level of 21200.2 will be tested if it is successfully broken and closes below that level, then #NDX will continue its weakening to the level of 20663.3 as its main target and if the volatility and momentum of its weakening support it, the level of 19963.7 will be the next target to be aimed for.
(Disclaimer)
You have already liked this post today
*El análisis de mercado publicado aquí tiene la finalidad de incrementar su conocimiento, más no darle instrucciones para realizar una operación.


