Vea también

 01.05.2025 06:30 AM
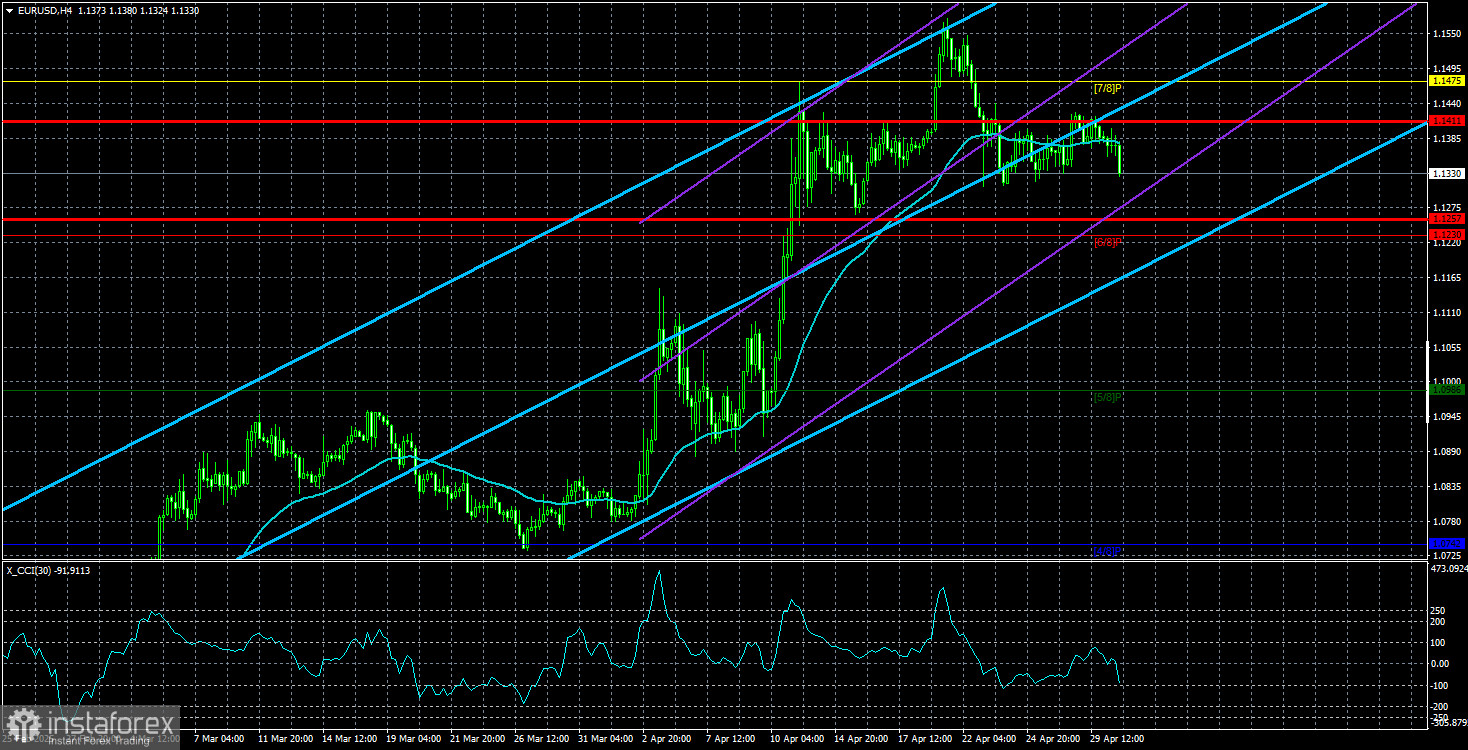
The EUR/USD currency pair continued trading within the same sideways channel of 1.1321–1.1426 on Wednesday, clearly visible on the hourly time frame. Despite a massive amount of macroeconomic data from the Eurozone and the U.S., the market once again found no need to react — or even pay attention. Technically, if you switch to the 5-minute chart, you could identify the exact moments when the market responded to the data. But who needs such reaction, such movements, if the flat market has already lasted three weeks?
The most interesting report in the first half of Wednesday was Eurozone Q1 GDP. Traders expected to see a maximum increase of 0.2%, but in reality, the European economy grew twice as much — 0.4% quarter-over-quarter. Needless to say, there was no corresponding rise in the euro? That's because economic data simply doesn't matter to anyone right now. And 0.4% growth is only slightly better than 0.2%. The European economy is still growing very slowly — and may grow even slower once Donald Trump's tariffs start to take effect. That could happen very soon, meaning the European economy may slip into full stagnation.
Meanwhile, Donald Trump continues to slowly but surely "reverse course." Let us recall that the U.S. President first introduced a 3-month grace period for countries on his "blacklist," then stated that the 145% tariffs against China, of course, would not be permanent. Yesterday it was reported that Trump, in a show of generosity, decided to reimburse U.S. companies for part of the funds they've paid in auto import tariffs. The 25% tariff on imported auto products remains in place, but Trump now plans to reimburse companies 3.75%.
Naturally, the market isn't reacting to this stream of "generosity" from the American president. Moreover, Amazon has begun displaying next to its price tags how much prices have increased due to Trump's tariffs. This is done so consumers clearly see how much more expensive certain products have become because of Trump — and to understand that Amazon itself is not to blame for the price increases. The White House immediately responded by declaring that Jeff Bezos is a Chinese agent and working for China. In short, Americans are surviving however they can, while Trump doesn't see any reason to respond to reporters' questions about public outrage over the tariffs — from voters who had supported him in the election.
So what do we have in the end? The dollar still isn't rising because the market doesn't want to buy it under the current White House policy. Macroeconomic data continues to be ignored. Everyone is still expecting a recession in the U.S. economy.
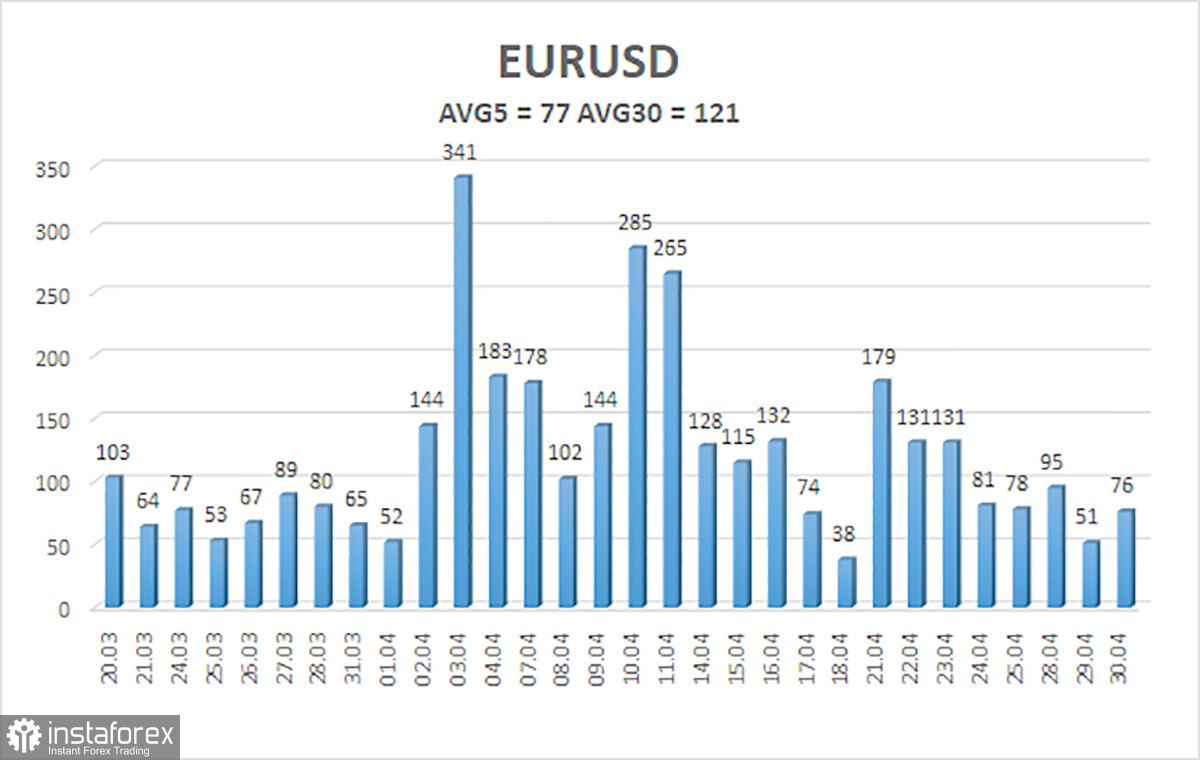
The average volatility of the EUR/USD currency pair over the last 5 trading days as of May 1 is 77 points and is characterized as "average." We expect the pair to move between the levels of 1.1257 and 1.1411 on Thursday. The senior linear regression channel is pointing upward, indicating a short-term bullish trend. The CCI indicator has entered the overbought area three times, each time leading only to a minor correction.
Nearest support levels:
S1 – 1.1230 S2 – 1.0986 S3 – 1.0742
Nearest resistance levels:
R1 – 1.1475 R2 – 1.1719 R3 – 1.1963
Trading Recommendations: The EUR/USD pair maintains its bullish trend. For months, we've repeatedly stated that we expect only a decline in the euro over the medium term, and at the moment, that outlook hasn't changed. The dollar still has no reason for a medium-term fall — except Donald Trump. But even that one reason could continue dragging the dollar down, as the market ignores all other factors. If you trade using pure technicals or based on Trump's actions, then long positions remain valid while the price is above the moving average, with a target of 1.1475. If the price consolidates below the moving average, shorts become formally valid with targets at 1.1230 and 1.0986, but it's very hard to believe in a strong dollar rally right now. In recent weeks, there has been no news of escalation or de-escalation in the trade war, so the market remains in a flat state.
Illustration explanations:


