Vea también

 21.05.2025 07:46 AM
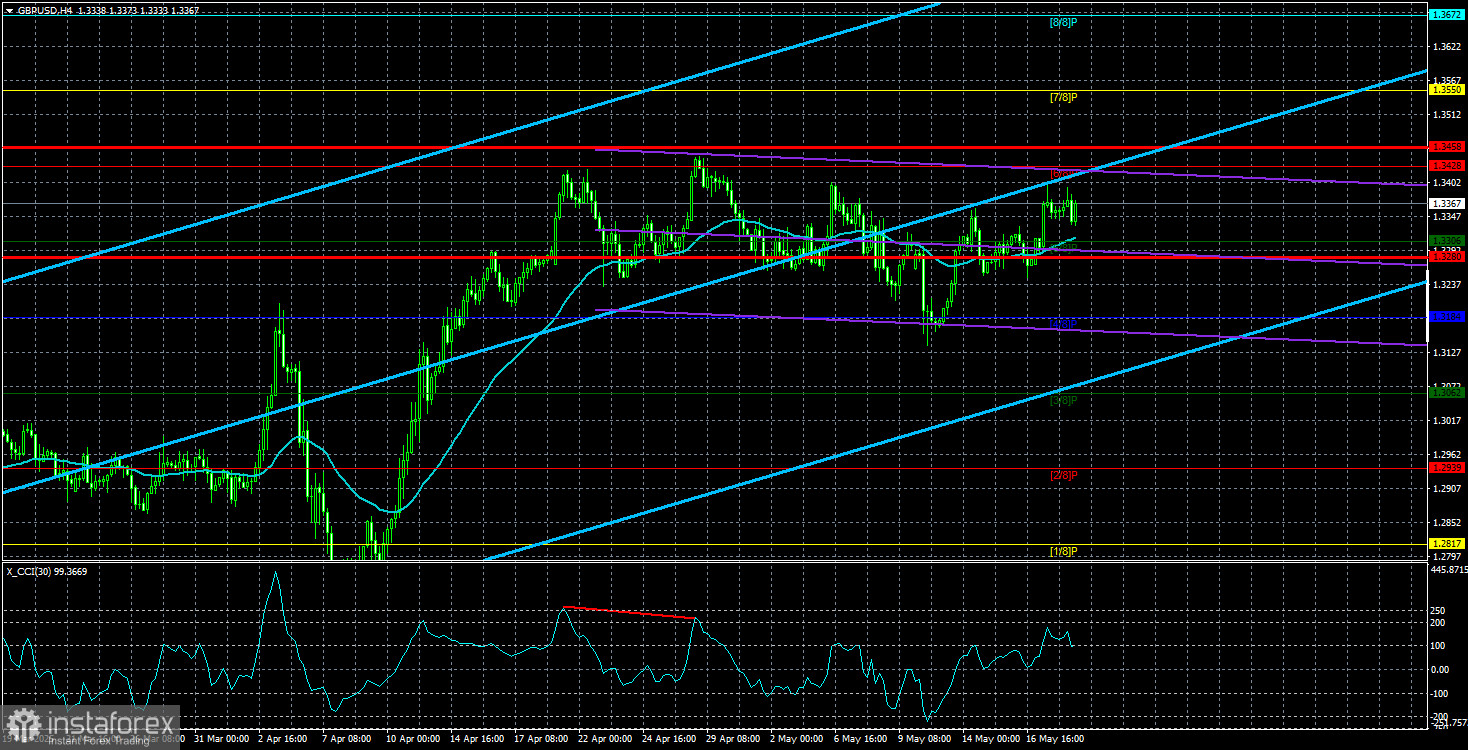
On Tuesday, the GBP/USD currency pair declined, unlike on Monday. While the euro's movement required searching for reasons behind the dollar's drop, the technical picture for the pound is straightforward and explains everything at the moment. For over a month now, GBP has been in a sideways range. This isn't the cleanest flat pattern with well-defined horizontal boundaries, but if we exclude the drop below 1.3200 (which occurred on news of a 115% reduction in trade tariffs between China and the U.S.), then we see the pound has been trading between 1.3220 and 1.3420 for over a month. In the last few sessions, we saw prices rising, and now we're seeing a decline. The macroeconomic background remains weak this week—there are no news drivers.
The pound cannot continue rising "out of thin air." It's worth remembering that there has been no actual merit in its 1500-pip appreciation. The British economy hasn't experienced a significant recovery, the country's political crisis has dragged on for nearly a decade, the fallout from Brexit is still being dealt with, and the Bank of England (unlike the Federal Reserve) is lowering interest rates. If it weren't for Donald Trump, we'd still be talking exclusively about the inevitable long-term decline of the British currency.
Let's not forget that three to four months ago, everything was pointing toward a resumption of the global downtrend. The market stubbornly sold off the dollar for two years in anticipation of Fed rate cuts. Eventually, it became clear that if the Fed did cut rates, it would do so very slowly, nowhere near the pace that had already been priced in. Before Trump's return, we were confident the dollar would continue its 16-year trend against the euro and pound.
Then Trump came back, bulldozing the global stage with his demands, threats, and ultimatums—and the dollar plunged. There's a term, "black swan"—an event that can't be predicted but will inevitably occur. It seems Trump has become the black swan for the dollar. After all, if you think about it, the dollar keeps falling, and this decline can now always be explained by the erosion of the dollar's status as the world's reserve currency. Who would be surprised?
Over the next four years, any decline in the dollar's value can be attributed to Trump. As a result, we expect many market moves in the near future that will be nearly impossible to explain, even in hindsight. After the market intensely priced in the U.S. credit rating downgrade, while ignoring the Fed's hawkish stance and other bullish factors for the dollar, it's clear that market movements remain largely irrational.
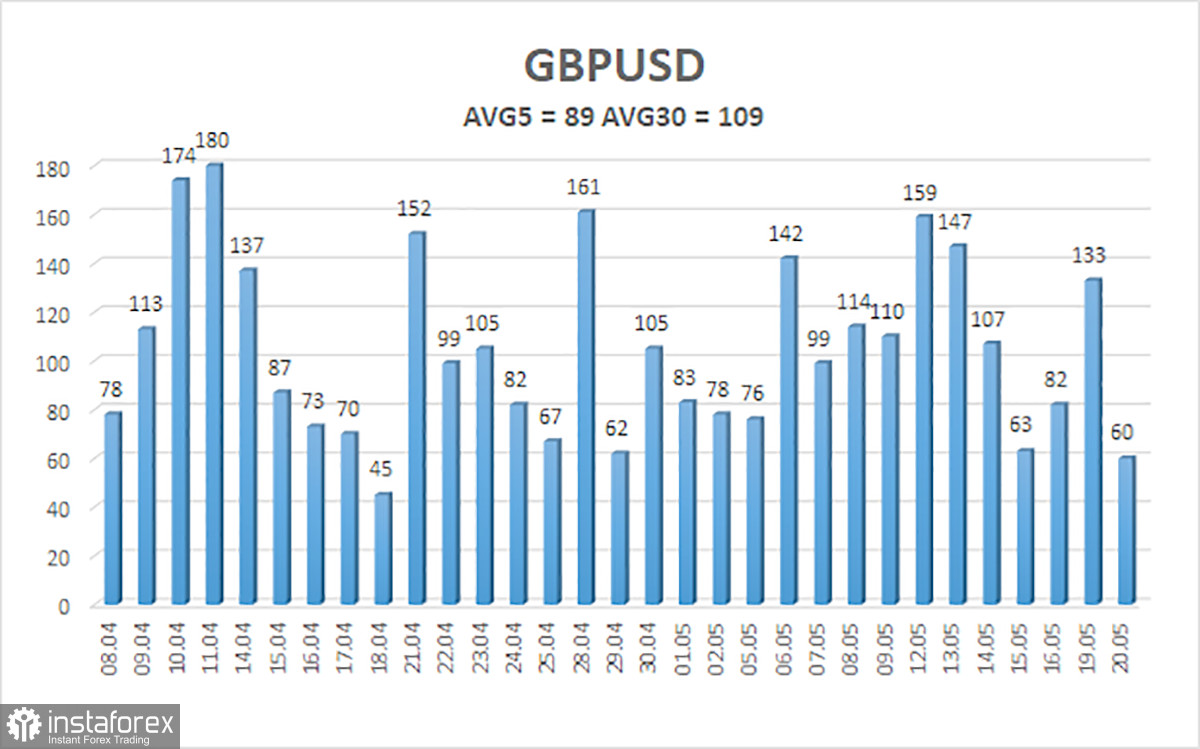
The average volatility for GBP/USD over the past five trading days is 89 pips, which qualifies as "average." On Wednesday, May 21, we expect movement within the range of 1.3280 to 1.3458. The long-term regression channel remains upward-facing, indicating a clear uptrend. The CCI indicator hasn't reached extreme zones recently.
S1 – 1.3306
S2 – 1.3184
S3 – 1.3062
R1 – 1.3428
R2 – 1.3550
R3 – 1.3672
The GBP/USD pair maintains a long-term uptrend and has resumed its correction due to several factors (Fed and BoE policies, de-escalation of the trade war). We still believe there's no fundamental reason for the pound to rise. If the trade conflict continues to ease (and all signs point that way), the dollar could return to the 1.2300–1.2400 area, where it began its "Trump-related" fall. However, given the market's current reluctance to buy the dollar, that scenario seems unlikely. We believe long positions are no longer justified against the backdrop of easing trade tensions, but the market is also unwilling to engage in short positions, which makes a strong downward movement equally out of reach for now. A new downward wave toward 1.3280 and 1.3184 may begin soon, but we need confirmation through a break below the moving average.
Linear Regression Channels help determine the current trend. If both channels are aligned, it indicates a strong trend.
Moving Average Line (settings: 20,0, smoothed) defines the short-term trend and guides the trading direction.
Murray Levels act as target levels for movements and corrections.
Volatility Levels (red lines) represent the likely price range for the pair over the next 24 hours based on current volatility readings.
CCI Indicator: If it enters the oversold region (below -250) or overbought region (above +250), it signals an impending trend reversal in the opposite direction.


