Vea también

 21.05.2025 05:06 AM
This morning, on the daily chart, the price pierced the MACD line with an upper shadow. Visually, the trend appears upward, and the Marlin oscillator's signal line also points upward, remaining in the growth zone. However, all of these signs could be deceptive.
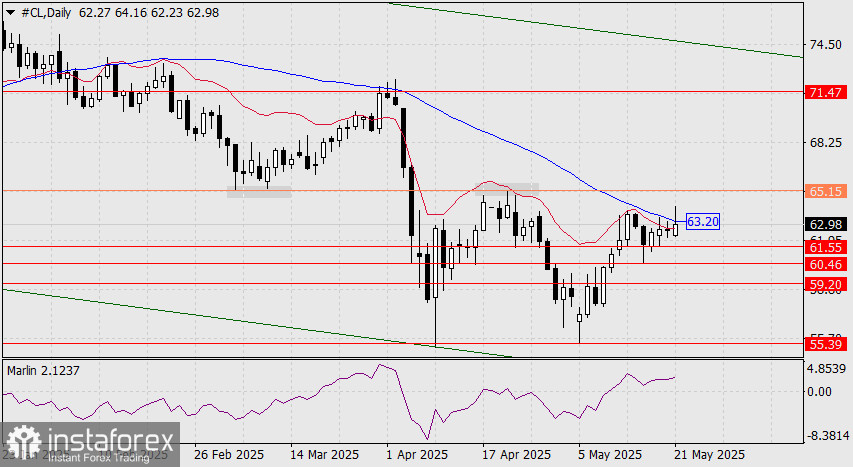
The main obstacle to further growth is the strong level at 65.15, which has been a resistance area since the second half of April and a support zone since the first third of March. Even if the price manages to consolidate above the MACD line, a firm close above the 65.15 level would still be a final condition for continued growth.
If today's daily candle closes below the MACD line (63.20), pressure on the price will unlikely ease. The price will likely aim to break through the support levels at 61.55 and 60.46. After that, the Marlin oscillator could join the downward movement if it transitions into negative territory.
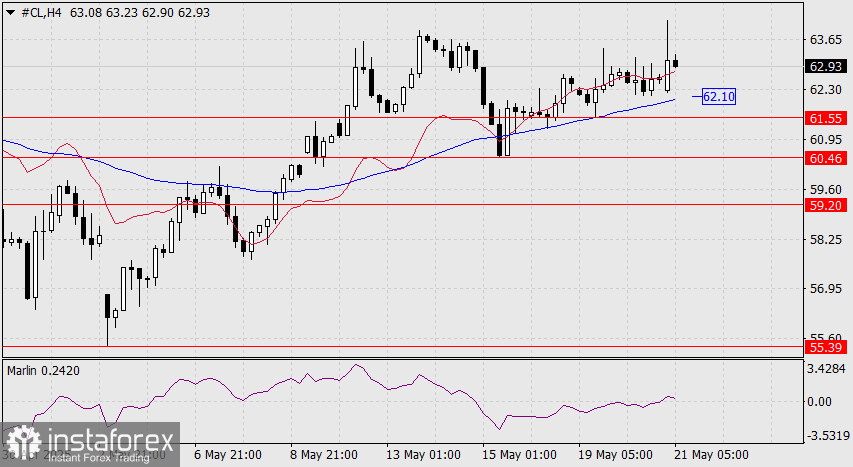
On the four-hour chart, the upward movement's instability is reflected in the Marlin oscillator, which is hovering near the neutral zero line. A breakdown below the MACD line (62.10) would intensify bearish sentiment. We await further developments.
You have already liked this post today
*El análisis de mercado publicado aquí tiene la finalidad de incrementar su conocimiento, más no darle instrucciones para realizar una operación.


