Vea también


 19.06.2025 11:20 AM
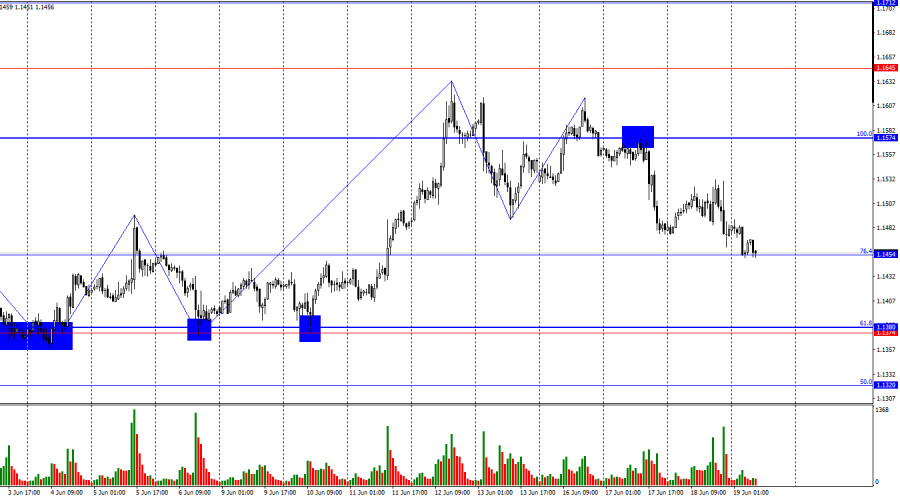
On Wednesday, the EUR/USD pair resumed its decline after a short pause and by Thursday morning settled right around the 76.4% Fibonacci retracement level at 1.1454. A rebound from this level will support the euro and lead to a slight rise toward the 100.0% Fibonacci level at 1.1574. A firm consolidation below 1.1454 would increase the likelihood of continued decline toward the support zone of 1.1374–1.1380.
The wave situation on the hourly chart remains simple and clear. The last completed upward wave did not break the peak of the previous wave, while the new downward wave broke below the previous low. Thus, the trend is currently beginning to shift into a "bearish" direction. Recent news about increased tariffs on steel and aluminum caused bears to retreat again, while the lack of real progress in U.S.–China negotiations is making them cautious. Therefore, I'm still not confident that a strong bearish trend will develop.
On Wednesday, the key event was the Federal Reserve meeting. Personally, I had no particular expectations from this event. It was clear from the outset that the regulator wouldn't announce new monetary easing, and that Jerome Powell would stick to his long-standing views. And so it happened. The rate remained at 4.5%, and Powell once again spoke about economic uncertainty, the risk of rising inflation, economic slowdown, and tariffs. Even the president of the FOMC had comments about Donald Trump's tariffs. Powell and his colleagues do not understand what the final form of the tariffs will be, so they are unable to make forecasts about GDP, inflation, or economic activity. Since the outcome of Trump's trade war remains entirely uncertain, the FOMC prefers to adopt a wait-and-see approach. Even the Fed's expectations for a rate change in 2025 remain unchanged—two rounds of easing of 0.25% each are still projected by year-end.
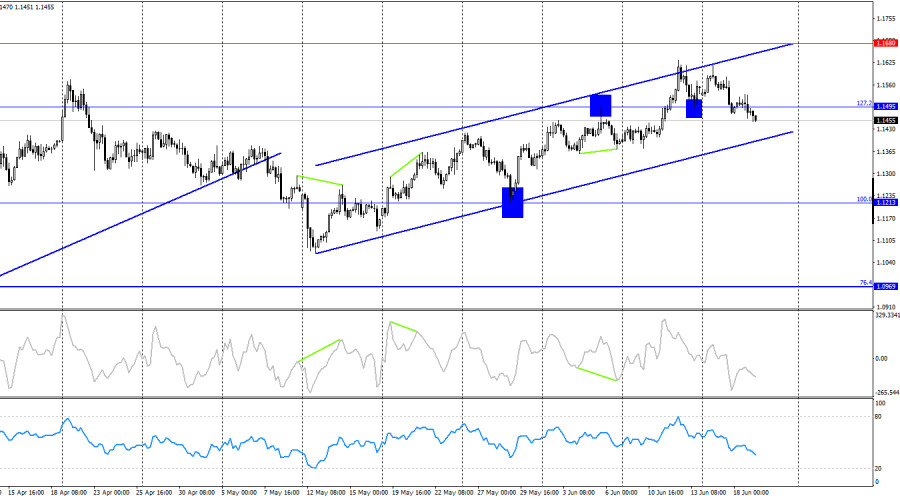
On the 4-hour chart, the pair returned to the 127.2% Fibonacci level at 1.1495 and consolidated below it. Therefore, the decline may continue toward the lower boundary of the upward trend channel, which still signals the preservation of a "bullish" trend. Consolidation below the trend channel would allow us to expect a stronger fall toward the 100.0% Fibonacci level at 1.1213. No developing divergences are currently observed.
COT Report (Commitments of Traders)
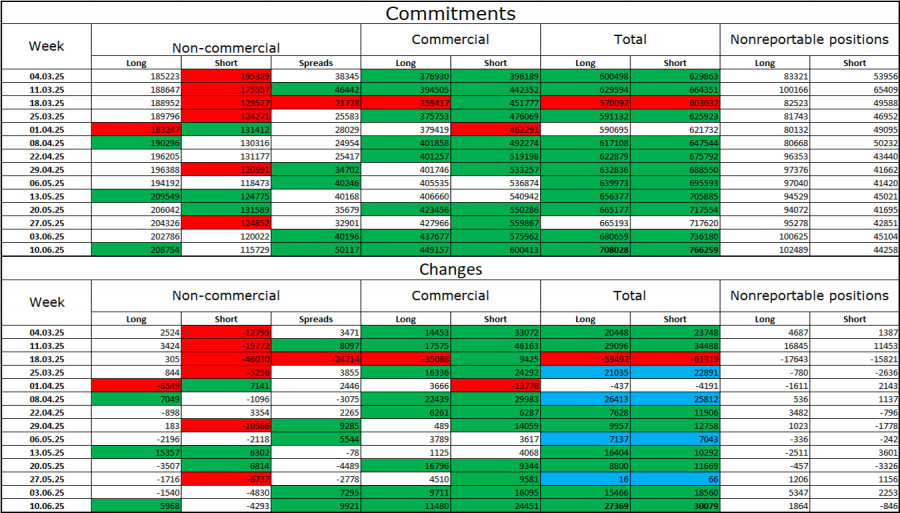
During the last reporting week, professional traders opened 5,968 long positions and closed 4,293 short positions. The sentiment of the "Non-commercial" group remains bullish, largely due to Donald Trump. The total number of long positions held by speculators now stands at 208,000, while short positions are at 115,000, with the gap generally widening. Thus, demand for the euro remains, while interest in the dollar does not. The situation remains unchanged.
For 19 consecutive weeks, large players have been reducing short positions and increasing long ones. The divergence in monetary policy between the ECB and the Fed is already significant, but Trump's policies remain the more influential factor for traders, as they could lead to a U.S. recession and various long-term structural problems for the American economy.
Economic Calendar for the U.S. and the Eurozone:
The economic calendar for June 19 contains only two significant events. Therefore, market sentiment on Thursday may be influenced in the morning, but afterward, any new developments will likely come from Trump or Middle East events.
EUR/USD Forecast and Trading Recommendations:
Selling the pair was possible after a close below 1.1574 on the hourly chart, targeting 1.1454. That target has now been met. New short positions can be considered upon a close below 1.1454, targeting 1.1374–1.1380. I would recommend buying only on a rebound from 1.1454, targeting 1.1574.
The Fibonacci level grids are drawn from 1.1574–1.1066 on the hourly chart and from 1.1214–1.0179 on the 4-hour chart.
You have already liked this post today
*El análisis de mercado publicado aquí tiene la finalidad de incrementar su conocimiento, más no darle instrucciones para realizar una operación.
InstaForex en cifras

Your IP address shows that you are currently located in the USA. If you are a resident of the United States, you are prohibited from using the services of InstaFintech Group including online trading, online transfers, deposit/withdrawal of funds, etc.
If you think you are seeing this message by mistake and your location is not the US, kindly proceed to the website. Otherwise, you must leave the website in order to comply with government restrictions.
Why does your IP address show your location as the USA?
Please confirm whether you are a US resident or not by clicking the relevant button below. If you choose the wrong option, being a US resident, you will not be able to open an account with InstaTrade anyway.
We are sorry for any inconvenience caused by this message.


