Vea también


 23.06.2025 04:56 AM
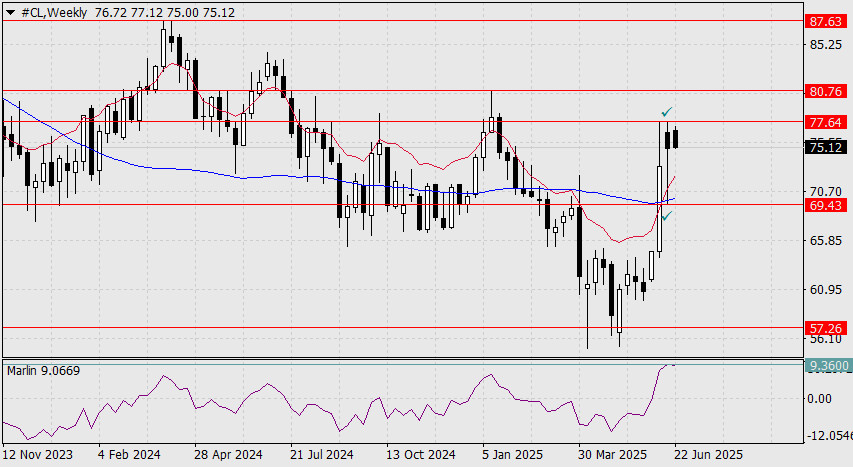
On the weekly chart, the signal line of the Marlin oscillator has begun to reverse from the 9.3600 level. Historically, this level has marked significant downward reversals—in April 2023, October 2021, and April 2019. Breakouts above this level have varied: some were strong (e.g., August 2023, February 2022), while others were weak and merely noise.
The current situation indicates the price is at a crossroads: continued geopolitical tension could drive further price increases, while declining global demand may lead to a reversal.
A consolidation above last week's high at 77.64 would support a geopolitically driven upward move. A decline below last week's low at 69.43, which would also mean a break below the MACD line support, would signal the start of a bearish scenario. Both scenarios are equally probable. Growth targets: 80.76 – high in January, 87.63 – high in April 2024. Downside target: 57.26 – low in March 2021.
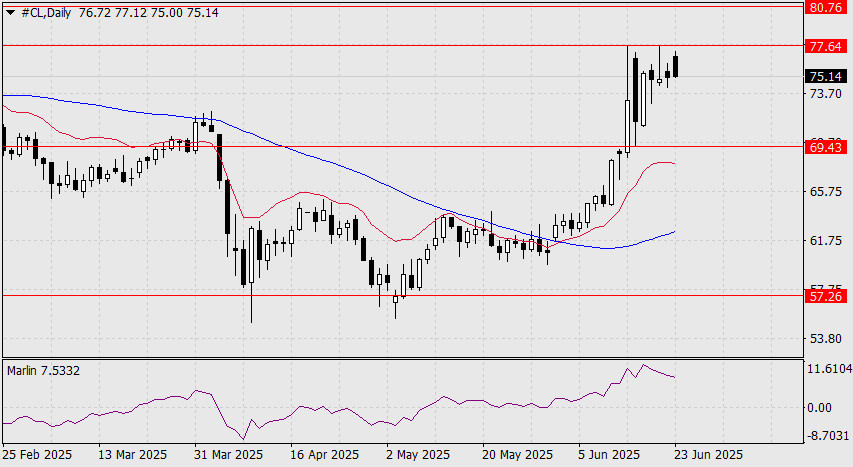
In the daily timeframe, the Marlin oscillator has entered the overbought zone. The last stronger impulse was in March 2022, when the price surged to 130.44. However, the current sharp reversal of the oscillator from the oversold zone may indicate a discharge before further growth.
Thus, key indicators for price movement are a breakout and consolidation above 77.64 or a drop and consolidation below 69.43.
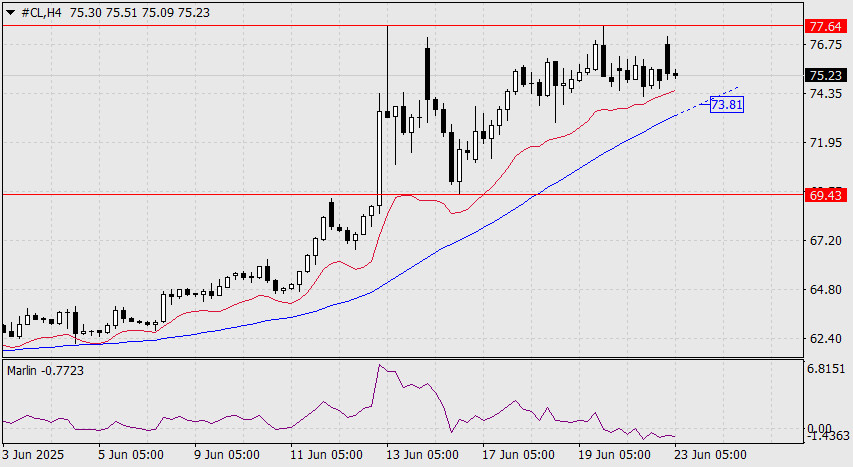
A primary signal of a downward reversal could be the price consolidating below the MACD line at 73.81 on the H4 chart.
You have already liked this post today
*El análisis de mercado publicado aquí tiene la finalidad de incrementar su conocimiento, más no darle instrucciones para realizar una operación.


