Vea también

 24.06.2025 10:44 AM
On the hourly chart, the GBP/USD pair on Monday rebounded from the support zone of 1.3357–1.3373, reversed in favor of the British pound, and consolidated above the 1.3425–1.3444 zone and the 127.2% Fibonacci retracement level at 1.3527. As a result, the upward movement may continue towards the next resistance zone of 1.3611–1.3633, from where the pound began its decline a week ago. Bears were unable to mount an attack for a long time, as the war in Iran is no longer a strong driver for the dollar.
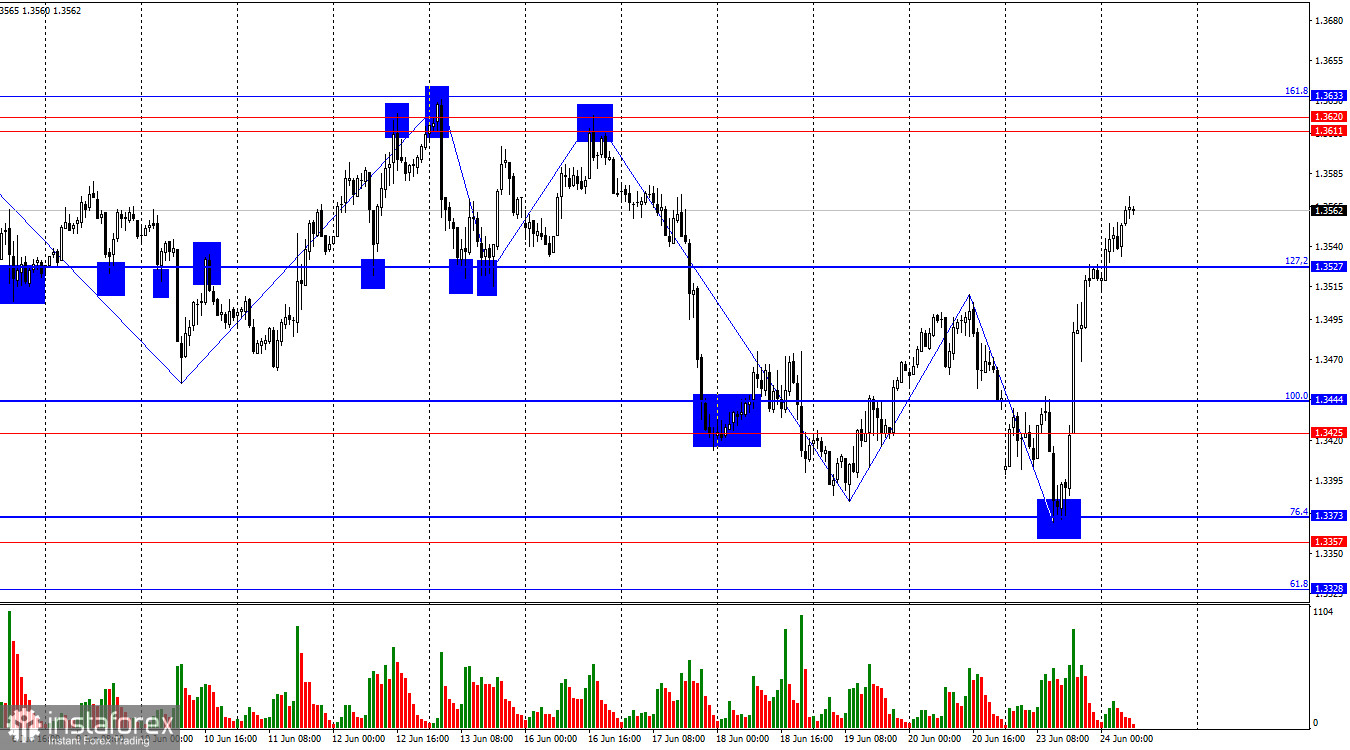
The wave situation now indicates the completion of the recent "bearish" trend, which lasted for about a week. The last completed downward wave broke the low of the previous wave by just a few points, while the new upward wave easily surpassed the previous high. Over the past week, bears were supported by news from the Middle East, with the dollar being the main beneficiary of the conflict. However, after the U.S. carried out its own strikes on Iran, the dollar lost its appeal among traders.
On Monday, aside from geopolitical news from the Middle East, there was also a lot of economic data. However, this data had no impact on market sentiment. Business activity indices in the UK exceeded traders' expectations, yet the pound declined in the first half of the day. Business activity indices in the U.S. services and manufacturing sectors also beat forecasts, but the dollar declined in the second half of the day. Currently, the market is focused entirely on geopolitics. For instance, according to some reports, Russia may come to Iran's defense. Iran itself may continue to strike Israel and American military bases. Qatar and Iraq are also ready to join the war against Iran. The situation in the Middle East is highly tense, and no one yet understands how it will end.
Alongside these developments, traders will need to monitor speeches by Bailey, Lagarde, and Powell. While their rhetoric is likely to remain unchanged from their previous addresses, this cannot be guaranteed with absolute certainty.
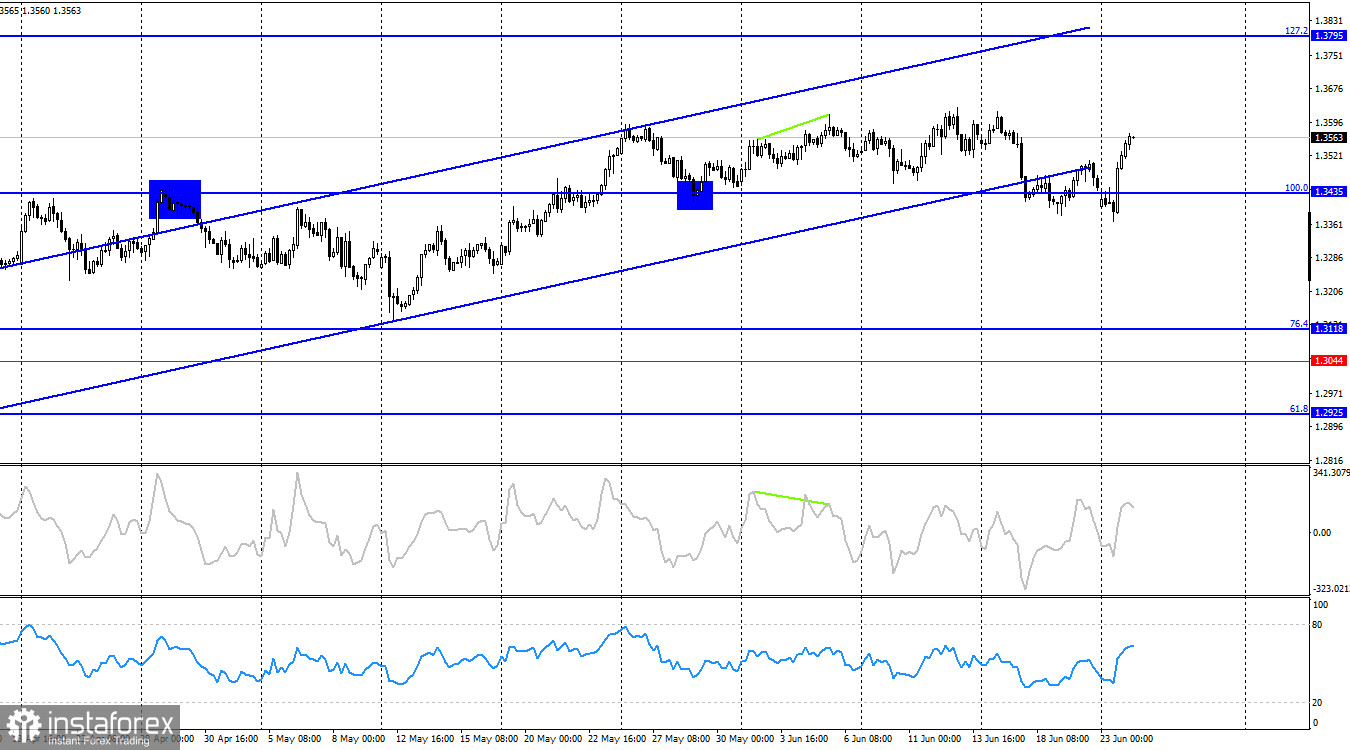
On the 4-hour chart, the pair returned to the 100.0% Fibonacci level at 1.3435, but the information background did not allow for a continuation of the decline. Bears managed to push the pair below the ascending trend channel, but even this did not lead to further downward momentum. At this stage, continued growth can be expected on both charts. No emerging divergences are observed on any indicator.
Commitments of Traders (COT) Report:
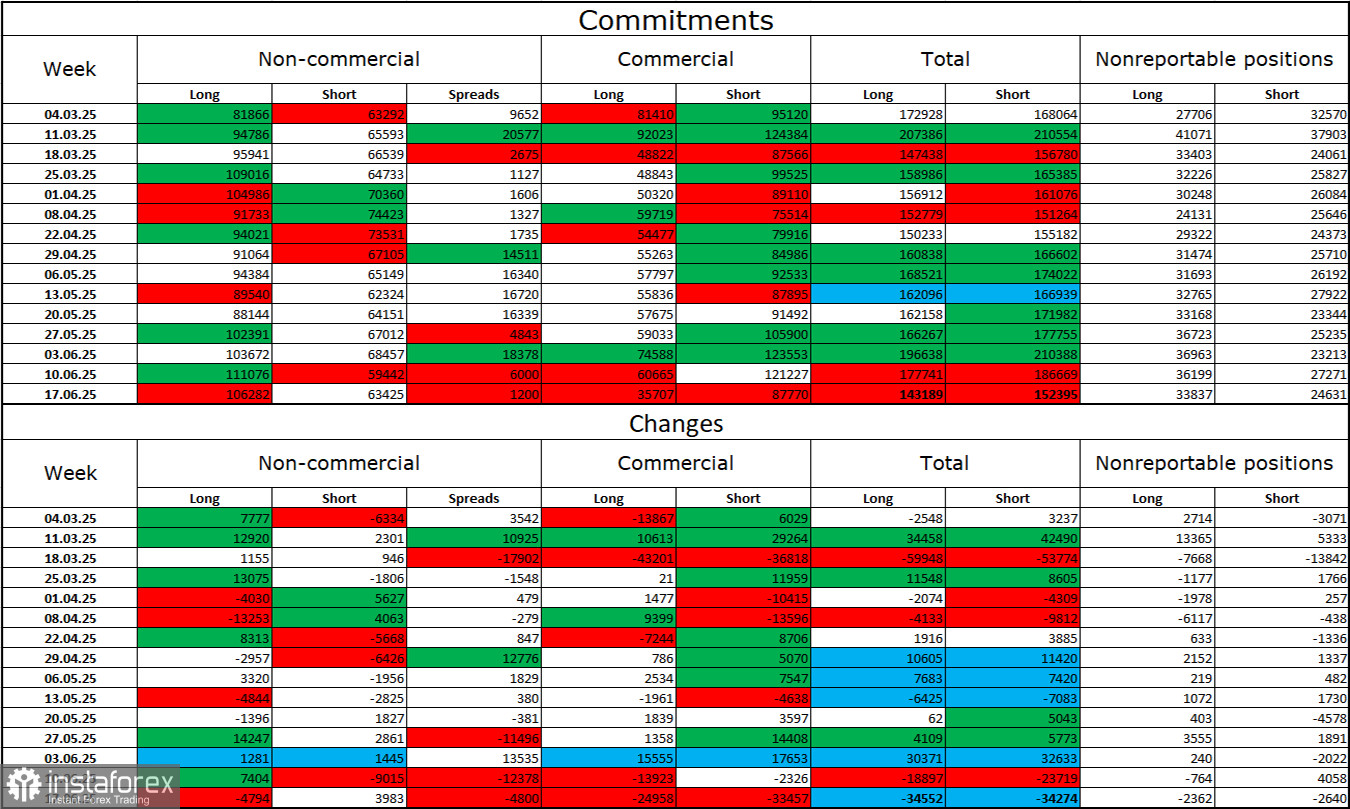
The sentiment of the "Non-commercial" trader category became less "bullish" in the latest reporting week. The number of long positions held by speculators decreased by 4,794, while the number of short positions increased by 3,983. However, bears have long since lost their market advantage and currently have no real chances for success. The gap between the number of long and short positions stands at 43,000 in favor of the bulls: 106,000 versus 63,000.
In my view, the pound still has downside potential, but the events of 2025 have completely shifted the market in the long term. Over the past 3 months, the number of long contracts has risen from 65,000 to 106,000, while short positions have declined from 76,000 to 63,000. Under Donald Trump, confidence in the dollar has weakened, and COT reports indicate that traders have little interest in buying the U.S. currency. Therefore, regardless of the broader news background, the dollar continues to fall amid developments surrounding Donald Trump.
News Calendar for the U.S. and UK:
Tuesday's economic calendar includes two very important events. The impact of the information background on market sentiment may be significant throughout the day.
GBP/USD Forecast and Trader Recommendations:
Selling the pair was possible after a close below the 1.3425–1.3444 zone, targeting 1.3367–1.3373 and 1.3328. The first target has been reached. I recommended buying after a close above the 1.3425–1.3444 zone, targeting 1.3527. This target was also reached. A close above the 1.3527 level allows holding long positions with a target at the 1.3611–1.3633 zone.
The Fibonacci grids are built from 1.3446–1.3139 on the hourly chart and from 1.3431–1.2104 on the 4-hour chart.


